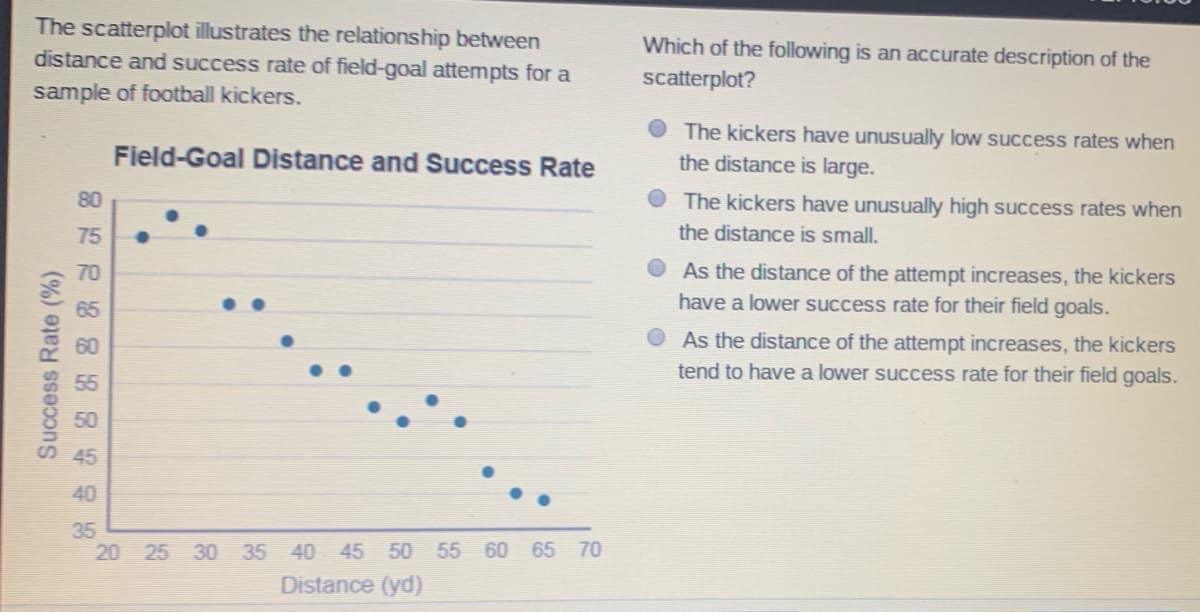
The scatterplot illustrates the relationship between distance and success rate of field-goal attempts for a Which of the following is an accurate description of the scatterplot? sample of football kickers. The kickers have unusually low success rates when the distance is large. Field-Goal Distance and Success Rate 80 The kickers have unusually high success rates when 75 the distance is small. As the distance of the attempt increases, the kickers have a lower success rate for their field goals. 70 As the distance of the attempt increases, the kickers tend to have a lower success rate for their field goals. 50 45 40 35 20 25 30 35 40 45 50 55 60 65 70 Distance (yd) Success Rate (%)


Continuous Probability Distributions
Probability distributions are of two types, which are continuous probability distributions and discrete probability distributions. A continuous probability distribution contains an infinite number of values. For example, if time is infinite: you could count from 0 to a trillion seconds, billion seconds, so on indefinitely. A discrete probability distribution consists of only a countable set of possible values.
Normal Distribution
Suppose we had to design a bathroom weighing scale, how would we decide what should be the range of the weighing machine? Would we take the highest recorded human weight in history and use that as the upper limit for our weighing scale? This may not be a great idea as the sensitivity of the scale would get reduced if the range is too large. At the same time, if we keep the upper limit too low, it may not be usable for a large percentage of the population!


Trending now
This is a popular solution!

Step by step
Solved in 2 steps


