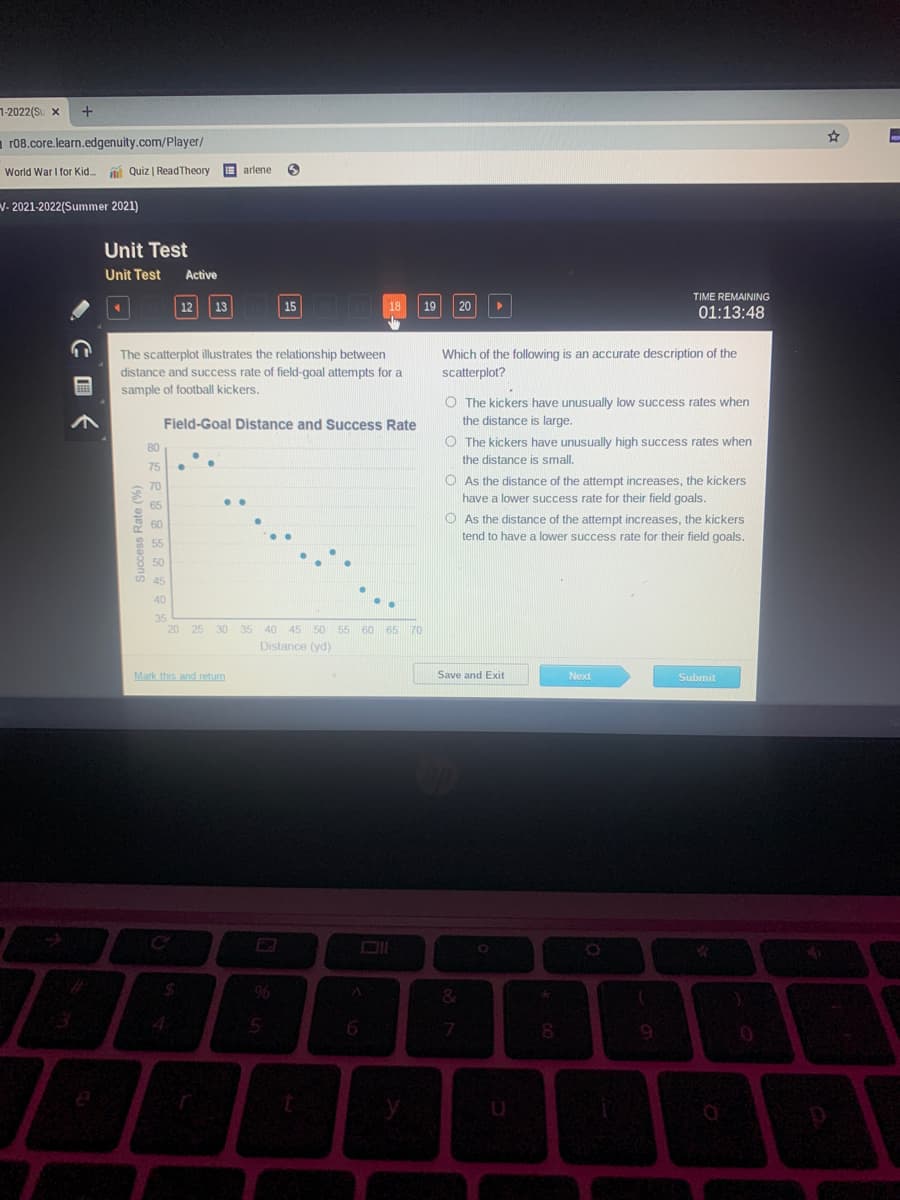
The scatterplot illustrates the relationship between distance and success rate of field-goal attempts for a sample of football kickers. Which of the following is an accurate description of the scatterplot? O The kickers have unusually low success rates when the distance is large. Field-Goal Distance and Success Rate O The kickers have unusually high success rates when the distance is small. O As the distance of the attempt increases, the kickers have a lower success rate for their field goals. 80 75 As the distance of the attempt increases, the kickers tend to have a lower success rate for their field goals. 45 40 35 20 25 30 35 40 45 50 55 60 65 70 Distance (yd) Mark this and retum Save and Exit Next Submit Success Rate (%)
The scatterplot illustrates the relationship between distance and success rate of field-goal attempts for a sample of football kickers. Which of the following is an accurate description of the scatterplot? O The kickers have unusually low success rates when the distance is large. Field-Goal Distance and Success Rate O The kickers have unusually high success rates when the distance is small. O As the distance of the attempt increases, the kickers have a lower success rate for their field goals. 80 75 As the distance of the attempt increases, the kickers tend to have a lower success rate for their field goals. 45 40 35 20 25 30 35 40 45 50 55 60 65 70 Distance (yd) Mark this and retum Save and Exit Next Submit Success Rate (%)
Linear Algebra: A Modern Introduction
4th Edition
ISBN:9781285463247
Author:David Poole
Publisher:David Poole
Chapter4: Eigenvalues And Eigenvectors
Section4.6: Applications And The Perron-frobenius Theorem
Problem 25EQ
Related questions
Question

Transcribed Image Text:1-2022(Su x
+
1 r08.core.learn.edgenuity.com/Player/
World War I for Kid.
Quiz | ReadTheory arlene
v. 2021-2022(Summer 2021)
Unit Test
Unit Test
Active
TIME REMAINING
12 13
15
19
20
18
01:13:48
Which of the following is an accurate description of the
The scatterplot illustrates the relationship between
distance and success rate of field-goal attempts for a
sample of football kickers.
scatterplot?
O The kickers have unusually low success rates when
the distance is large.
Field-Goal Distance and Success Rate
O The kickers have unusually high success rates when
the distance is small.
O As the distance of the attempt increases, the kickers
80
75
70
have a lower success rate for their field goals.
65
O As the distance of the attempt increases, the kickers
60
tend to have a lower success rate for their field goals.
55
50
O 45
40
35
20 25 30 35 40
45 50 55 60 65 70
Distance (yd)
Mark this and retum
Save and Exit
Next
Submit
96
7.
Success Rate (
Expert Solution
This question has been solved!
Explore an expertly crafted, step-by-step solution for a thorough understanding of key concepts.
This is a popular solution!
Trending now
This is a popular solution!
Step by step
Solved in 2 steps with 2 images

Recommended textbooks for you

Linear Algebra: A Modern Introduction
Algebra
ISBN:
9781285463247
Author:
David Poole
Publisher:
Cengage Learning

Linear Algebra: A Modern Introduction
Algebra
ISBN:
9781285463247
Author:
David Poole
Publisher:
Cengage Learning