statistics student wanted to find out whether gender and the use of turn signals when driving were independent. When driving his truck for several weeks, he noted the gender of each person he observed and whether he or she used the turn signal when arning or changing lanes. A second student collected similar data with a smaller sample size. The data the students collected are shown in the tables below. Complete parts (a) through (d) below. E Click the icon to view the first student's data. A Click the icon to view the second student's data. From the first student's data, what percentage of men used turn signals, and what percentage of women used them? 60.9 % of men used turn signals, and 72.9 % of women used them. Round to one decimal place as needed.) From the first student's data, assuming the conditions are met (although admittedly this was not a random selection), find a 95% confidence interval for the difference in percentages (men - women). State whether the interval captures 0, and explain hether this provides evidence that the proportions of men and women who use signals differ in the population. he 95% confidence interval for the difference in percentages (men - women) is ( %. %). Round to one decimal place as needed.) - X First student's turn signal data Second student's turn signal data Men Women Men Women Turn signal 522 488 Turn signal 52 49 No signal 335 181 No signal 34 18 Total 857 669 Total 86 67 Print Done Print Done
statistics student wanted to find out whether gender and the use of turn signals when driving were independent. When driving his truck for several weeks, he noted the gender of each person he observed and whether he or she used the turn signal when arning or changing lanes. A second student collected similar data with a smaller sample size. The data the students collected are shown in the tables below. Complete parts (a) through (d) below. E Click the icon to view the first student's data. A Click the icon to view the second student's data. From the first student's data, what percentage of men used turn signals, and what percentage of women used them? 60.9 % of men used turn signals, and 72.9 % of women used them. Round to one decimal place as needed.) From the first student's data, assuming the conditions are met (although admittedly this was not a random selection), find a 95% confidence interval for the difference in percentages (men - women). State whether the interval captures 0, and explain hether this provides evidence that the proportions of men and women who use signals differ in the population. he 95% confidence interval for the difference in percentages (men - women) is ( %. %). Round to one decimal place as needed.) - X First student's turn signal data Second student's turn signal data Men Women Men Women Turn signal 522 488 Turn signal 52 49 No signal 335 181 No signal 34 18 Total 857 669 Total 86 67 Print Done Print Done

Glencoe Algebra 1, Student Edition, 9780079039897, 0079039898, 2018
18th Edition
ISBN:9780079039897
Author:Carter
Publisher:Carter
Chapter10: Statistics
Section10.6: Summarizing Categorical Data
Problem 10CYU

Related questions
Question
Transcribed Image Text:A statistics student wanted to find out whether gender and the use of turn signals when driving were independent. When driving his truck for several weeks, he noted the gender of each person he observed and whether he or she used the turn signal when
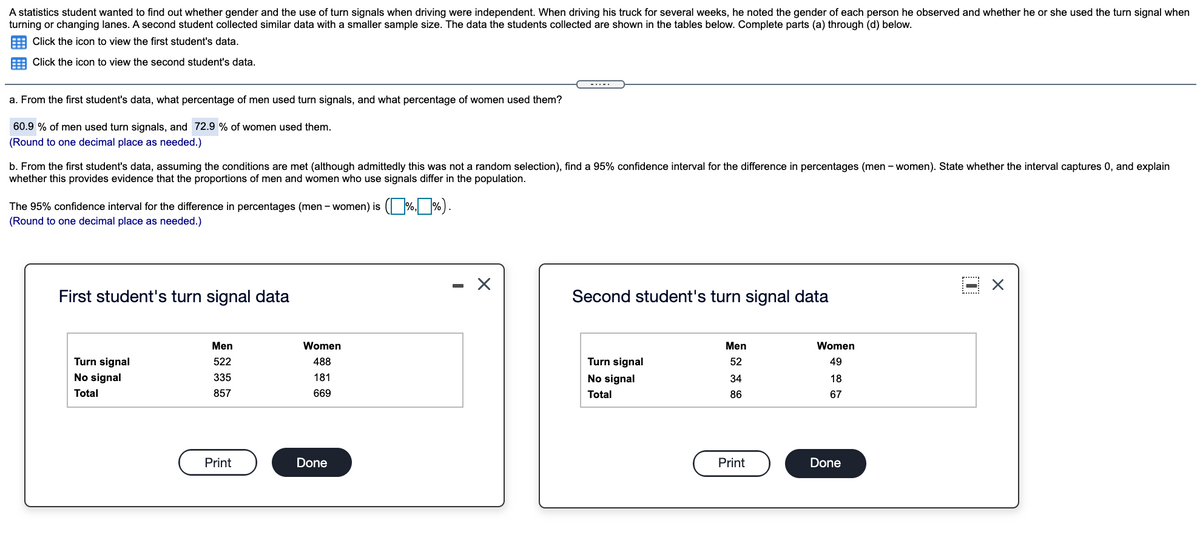
turning or changing lanes. A second student collected similar data with a smaller sample size. The data the students collected are shown in the tables below. Complete parts (a) through (d) below.
E Click the icon to view the first student's data.
Click the icon to view the second student's data.
-.--.
a. From the first student's data, what percentage of men used turn signals, and what percentage of women used them?
60.9 % of men used turn signals, and 72.9 % of women used them.
(Round to one decimal place as needed.)
b. From the first student's data, assuming the conditions are met (although admittedly this was not a random selection), find a 95% confidence interval for the difference in percentages (men - women). State whether the interval captures 0, and explain
whether this provides evidence that the proportions of men and women who use signals differ in the population.
The 95% confidence interval for the difference in percentages (men - women) is ( %, %).
(Round to one decimal place as needed.)
- X
First student's turn signal data
Second student's turn signal data
Men
Women
Men
Women
Turn signal
522
488
Turn signal
52
49
No signal
335
181
No signal
34
18
Total
857
669
Total
86
67
Print
Done
Print
Done
Expert Solution
This question has been solved!
Explore an expertly crafted, step-by-step solution for a thorough understanding of key concepts.

This is a popular solution!

Trending now
This is a popular solution!

Step by step
Solved in 2 steps with 1 images

Recommended textbooks for you
Glencoe Algebra 1, Student Edition, 9780079039897…
Algebra
ISBN:
9780079039897
Author:
Carter
Publisher:
McGraw Hill
Glencoe Algebra 1, Student Edition, 9780079039897…
Algebra
ISBN:
9780079039897
Author:
Carter
Publisher:
McGraw Hill