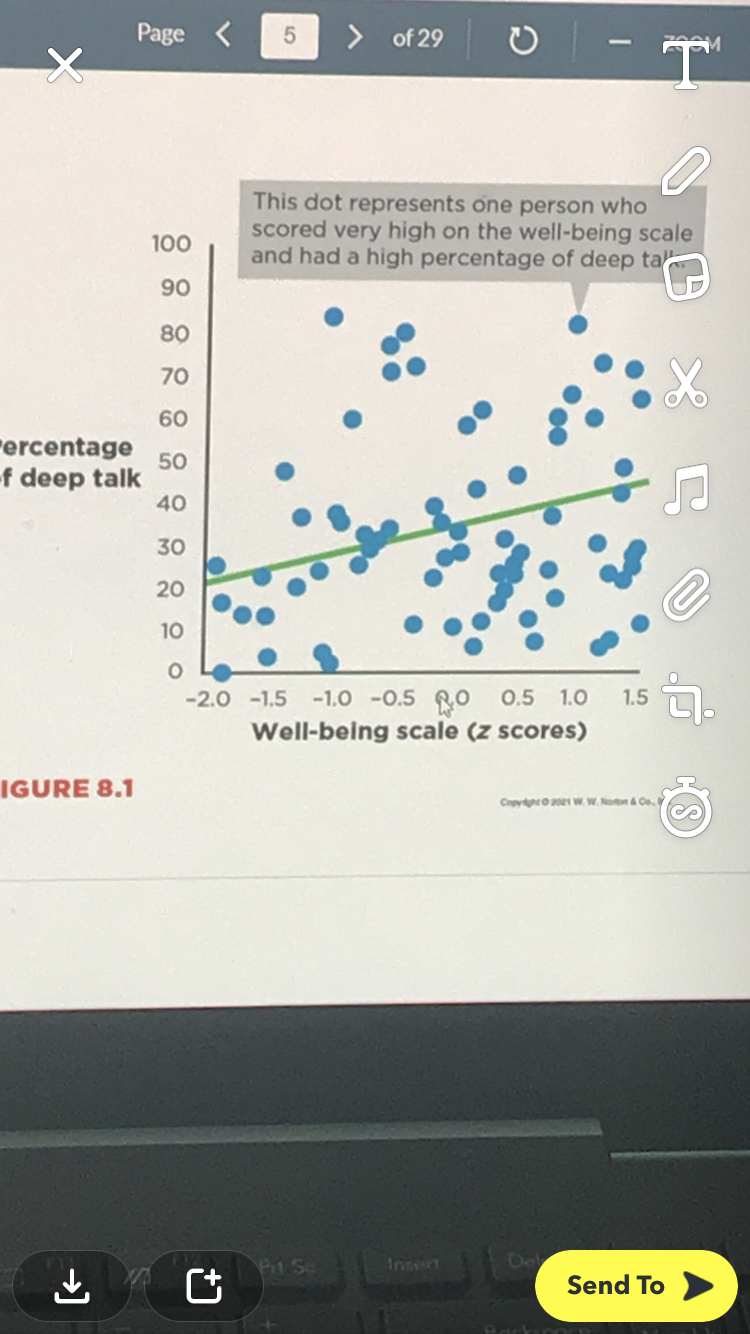
The scatterplot in Figure 8.1 shows the data from Mehl et al.’s (2010) research. The two quantitative variables are percentage of deep talk and z score on a well-being scale. By looking at the scatterplot, decide if the correlation is positive, negative, or zero
The scatterplot in Figure 8.1 shows the data from Mehl et al.’s (2010) research. The two quantitative variables are percentage of deep talk and z score on a well-being scale. By looking at the scatterplot, decide if the correlation is positive, negative, or zero

Glencoe Algebra 1, Student Edition, 9780079039897, 0079039898, 2018
18th Edition
ISBN:9780079039897
Author:Carter
Publisher:Carter
Chapter10: Statistics
Section10.4: Distributions Of Data
Problem 20PFA

Related questions
Question
PLEASE HELP !
The scatterplot in Figure 8.1 shows the data from Mehl et al.’s (2010) research. The two quantitative variables are percentage of deep talk and z score on a well-being scale. By looking at the scatterplot, decide if thecorrelation is positive, negative, or zero?
The scatterplot in Figure 8.1 shows the data from Mehl et al.’s (2010) research. The two quantitative variables are percentage of deep talk and z score on a well-being scale. By looking at the scatterplot, decide if the
Group of answer choices
Positive
Negative
Zero
none of the above
none of the above
Transcribed Image Text:Page <
> of 29
This dot represents one person who
scored very high on the well-being scale
and had a high percentage of deep ta
100
90
80
70
60
ercentage
50
-f deep talk
40
30
20
10
-2.0 -1.5 -1.0 -0.5 Ro 0.5 1.0
Well-being scale (z scores)
1.5
IGURE 8.1
Copv o2o W. W. Norn Co.
Send To
Insert
Expert Solution
This question has been solved!
Explore an expertly crafted, step-by-step solution for a thorough understanding of key concepts.

This is a popular solution!

Trending now
This is a popular solution!

Step by step
Solved in 2 steps with 1 images

Recommended textbooks for you
Glencoe Algebra 1, Student Edition, 9780079039897…
Algebra
ISBN:
9780079039897
Author:
Carter
Publisher:
McGraw Hill

Holt Mcdougal Larson Pre-algebra: Student Edition…
Algebra
ISBN:
9780547587776
Author:
HOLT MCDOUGAL
Publisher:
HOLT MCDOUGAL
Glencoe Algebra 1, Student Edition, 9780079039897…
Algebra
ISBN:
9780079039897
Author:
Carter
Publisher:
McGraw Hill
Holt Mcdougal Larson Pre-algebra: Student Edition…
Algebra
ISBN:
9780547587776
Author:
HOLT MCDOUGAL
Publisher:
HOLT MCDOUGAL