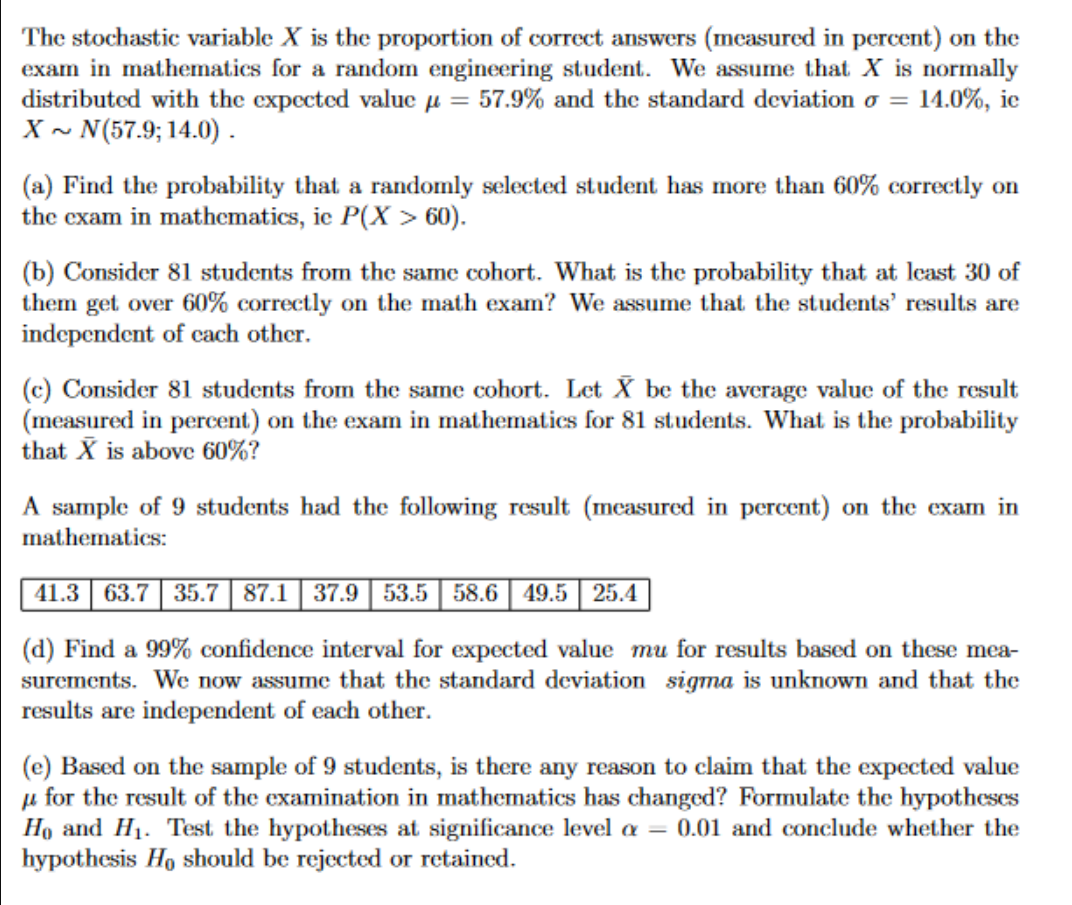
The stochastic variable X is the proportion of correct answers (measured in percent) on the exam in mathematics for a random engineering student. We assume that X is normally distributed with the expected value μ = 57.9% and the standard deviation o = 14.0%, ic X~ N(57.9; 14.0). (a) Find the probability that a randomly selected student has more than 60% correctly on the exam in mathematics, ie P(X> 60). (b) Consider 81 students from the same cohort. What is the probability that at least 30 of them get over 60% correctly on the math exam? We assume that the students' results are independent of each other. (c) Consider 81 students from the same cohort. Let X be the average value of the result (measured in percent) on the exam in mathematics for 81 students. What is the probability that X is above 60%? A sample of 9 students had the following result (measured in percent) on the exam in mathematics: 41.3 63.7 35.7 87.1 37.9 53.5 58.6 49.5 25.4 (d) Find a 99% confidence interval for expected value mu for results based on these mea- surements. We now assume that the standard deviation sigma is unknown and that the results are independent of each other. (e) Based on the sample of 9 students, is there any reason to claim that the expected value u for the result of the examination in mathematics has changed? Formulate the hypotheses Ho and H₁. Test the hypotheses at significance level = 0.01 and conclude whether the hypothesis Ho should be rejected or retained.
The stochastic variable X is the proportion of correct answers (measured in percent) on the exam in mathematics for a random engineering student. We assume that X is normally distributed with the expected value μ = 57.9% and the standard deviation o = 14.0%, ic X~ N(57.9; 14.0). (a) Find the probability that a randomly selected student has more than 60% correctly on the exam in mathematics, ie P(X> 60). (b) Consider 81 students from the same cohort. What is the probability that at least 30 of them get over 60% correctly on the math exam? We assume that the students' results are independent of each other. (c) Consider 81 students from the same cohort. Let X be the average value of the result (measured in percent) on the exam in mathematics for 81 students. What is the probability that X is above 60%? A sample of 9 students had the following result (measured in percent) on the exam in mathematics: 41.3 63.7 35.7 87.1 37.9 53.5 58.6 49.5 25.4 (d) Find a 99% confidence interval for expected value mu for results based on these mea- surements. We now assume that the standard deviation sigma is unknown and that the results are independent of each other. (e) Based on the sample of 9 students, is there any reason to claim that the expected value u for the result of the examination in mathematics has changed? Formulate the hypotheses Ho and H₁. Test the hypotheses at significance level = 0.01 and conclude whether the hypothesis Ho should be rejected or retained.

MATLAB: An Introduction with Applications
6th Edition
ISBN:9781119256830
Author:Amos Gilat
Publisher:Amos Gilat
Chapter1: Starting With Matlab
Section: Chapter Questions
Problem 1P

Related questions
Question
Need help with only D and E
Transcribed Image Text:The stochastic variable X is the proportion of correct answers (measured in percent) on the
exam in mathematics for a random engineering student. We assume that X is normally
distributed with the expected value μ = 57.9% and the standard deviation o = = 14.0%, ic
X~ N(57.9; 14.0).
(a) Find the probability that a randomly selected student has more than 60% correctly on
the exam in mathematics, ie P(X > 60).
(b) Consider 81 students from the same cohort. What is the probability that at least 30 of
them get over 60% correctly on the math exam? We assume that the students' results are
independent of each other.
(c) Consider 81 students from the same cohort. Let X be the average value of the result
(measured in percent) on the exam in mathematics for 81 students. What is the probability
that X is above 60%?
A sample of 9 students had the following result (measured in percent) on the exam in
mathematics:
41.3 63.7 35.7 87.1 37.9 53.5 58.6 49.5 25.4
(d) Find a 99% confidence interval for expected value mu for results based on these mea-
surements. We now assume that the standard deviation sigma is unknown and that the
results are independent of each other.
(e) Based on the sample of 9 students, is there any reason to claim that the expected value
for the result of the examination in mathematics has changed? Formulate the hypotheses
Ho and H₁. Test the hypotheses at significance level a = 0.01 and conclude whether the
hypothesis Ho should be rejected or retained.
Expert Solution
This question has been solved!
Explore an expertly crafted, step-by-step solution for a thorough understanding of key concepts.

Step by step
Solved in 3 steps

Recommended textbooks for you
MATLAB: An Introduction with Applications
Statistics
ISBN:
9781119256830
Author:
Amos Gilat
Publisher:
John Wiley & Sons Inc

Probability and Statistics for Engineering and th…
Statistics
ISBN:
9781305251809
Author:
Jay L. Devore
Publisher:
Cengage Learning

Statistics for The Behavioral Sciences (MindTap C…
Statistics
ISBN:
9781305504912
Author:
Frederick J Gravetter, Larry B. Wallnau
Publisher:
Cengage Learning
MATLAB: An Introduction with Applications
Statistics
ISBN:
9781119256830
Author:
Amos Gilat
Publisher:
John Wiley & Sons Inc
Probability and Statistics for Engineering and th…
Statistics
ISBN:
9781305251809
Author:
Jay L. Devore
Publisher:
Cengage Learning
Statistics for The Behavioral Sciences (MindTap C…
Statistics
ISBN:
9781305504912
Author:
Frederick J Gravetter, Larry B. Wallnau
Publisher:
Cengage Learning

Elementary Statistics: Picturing the World (7th E…
Statistics
ISBN:
9780134683416
Author:
Ron Larson, Betsy Farber
Publisher:
PEARSON

The Basic Practice of Statistics
Statistics
ISBN:
9781319042578
Author:
David S. Moore, William I. Notz, Michael A. Fligner
Publisher:
W. H. Freeman

Introduction to the Practice of Statistics
Statistics
ISBN:
9781319013387
Author:
David S. Moore, George P. McCabe, Bruce A. Craig
Publisher:
W. H. Freeman