The student government at Nassau Community College has been told that the student population consists of 53% female and 47% male. A random sample of 500 students consists of 265 females and 235 males, as shown in the table below. Does the sample data fit the population proportions at a= 5 %? Sample of Students Gender Number of students Females 265 Males 235
The student government at Nassau Community College has been told that the student population consists of 53% female and 47% male. A random sample of 500 students consists of 265 females and 235 males, as shown in the table below. Does the sample data fit the population proportions at a= 5 %? Sample of Students Gender Number of students Females 265 Males 235

Holt Mcdougal Larson Pre-algebra: Student Edition 2012
1st Edition
ISBN:9780547587776
Author:HOLT MCDOUGAL
Publisher:HOLT MCDOUGAL
Chapter11: Data Analysis And Probability
Section: Chapter Questions
Problem 8CR

Related questions

Question
100%
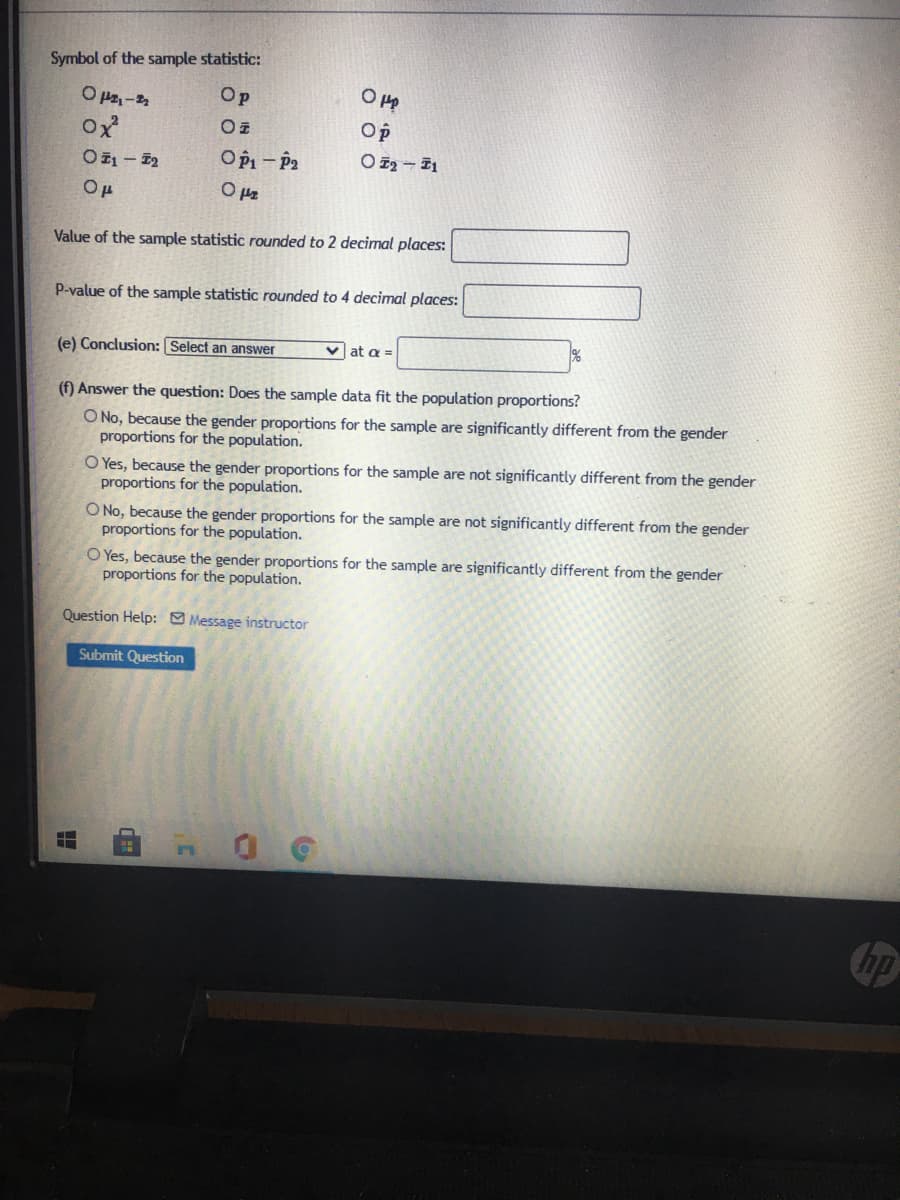
Transcribed Image Text:Symbol of the sample statistic:
Op
O p-
ox
Op
OPi - P2
Op
O pz
Value of the sample statistic rounded to 2 decimal places:
P-value of the sample statistic rounded to 4 decimal places:
(e) Conclusion: Select an answer
v at a =
(f) Answer the question: Does the sample data fit the population proportions?
O No, because the gender proportions for the sample are significantly different from the gender
proportions for the population.
O Yes, because the gender proportions for the sample are not significantly different from the gender
proportions for the population.
O No, because the gender proportions for the sample are not significantly different from the gender
proportions for the population.
O Yes, because the gender proportions for the sample are significantly different from the gender
proportions for the population.
Question Help: Message instructor
Submit Question
hp
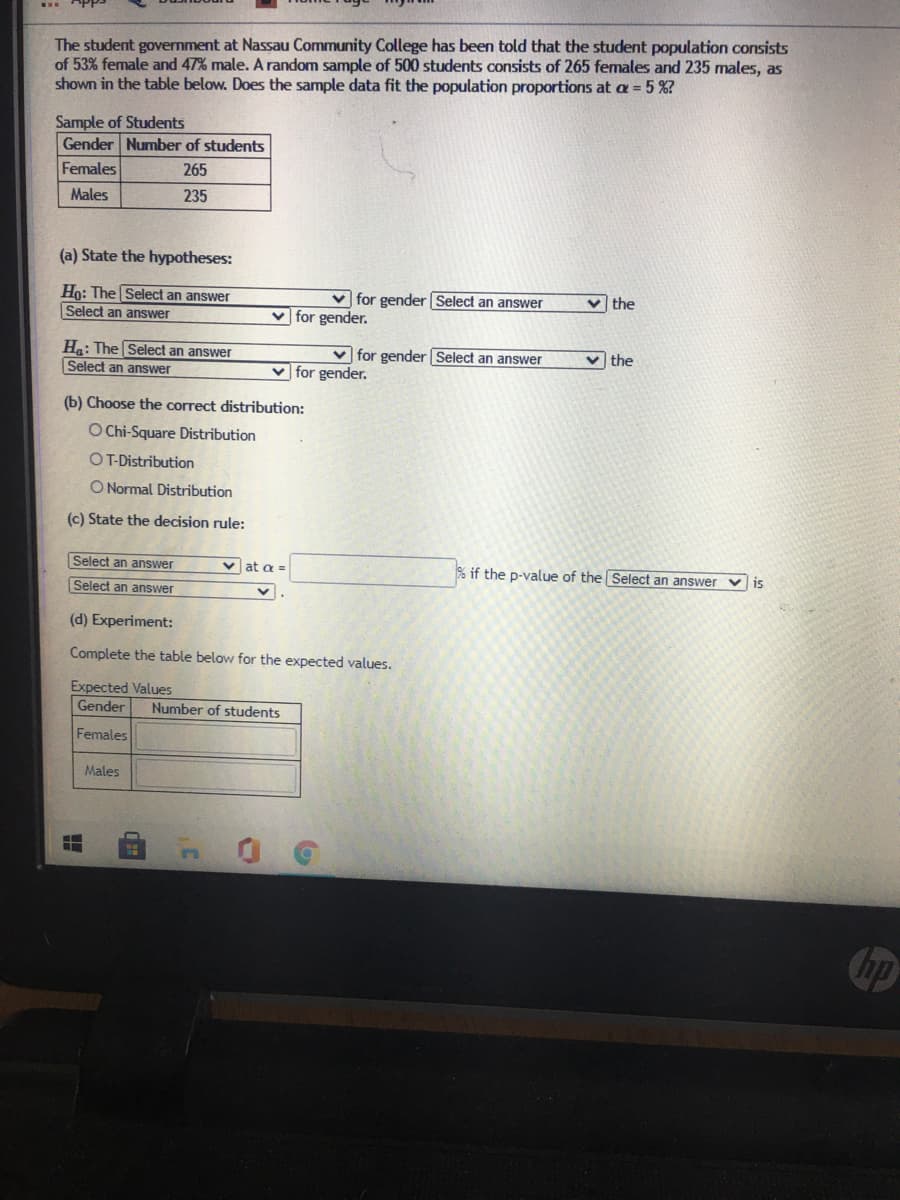
Transcribed Image Text:The student government at Nassau Community College has been told that the student population consists
of 53% female and 47% male. A random sample of 500 students consists of 265 females and 235 males, as
shown in the table below. Does the sample data fit the population proportions at a = 5 %?
Sample of Students
Gender Number of students
Females
265
Males
235
(a) State the hypotheses:
v the
Ho: The Select an answer
Select an answer
v for gender Select an answer
v for gender.
Ha: The Select an answer
v for gender Select an answer
v the
Select an answer
v for gender.
(b) Choose the correct distribution:
O Chi-Square Distribution
OT-Distribution
O Normal Distribution
(c) State the decision rule:
Select an answer
v at a =
% if the p-value of the Select an answer v is
Select an answer
(d) Experiment:
Complete the table below for the expected values.
Expected Values
Gender
Number of students
Females
Males
Chp
Expert Solution
This question has been solved!
Explore an expertly crafted, step-by-step solution for a thorough understanding of key concepts.

This is a popular solution!

Trending now
This is a popular solution!

Step by step
Solved in 4 steps with 1 images

Knowledge Booster


Learn more about
Need a deep-dive on the concept behind this application? Look no further. Learn more about this topic, statistics and related others by exploring similar questions and additional content below.Recommended textbooks for you
Holt Mcdougal Larson Pre-algebra: Student Edition…
Algebra
ISBN:
9780547587776
Author:
HOLT MCDOUGAL
Publisher:
HOLT MCDOUGAL

Algebra & Trigonometry with Analytic Geometry
Algebra
ISBN:
9781133382119
Author:
Swokowski
Publisher:
Cengage

College Algebra
Algebra
ISBN:
9781305115545
Author:
James Stewart, Lothar Redlin, Saleem Watson
Publisher:
Cengage Learning
Holt Mcdougal Larson Pre-algebra: Student Edition…
Algebra
ISBN:
9780547587776
Author:
HOLT MCDOUGAL
Publisher:
HOLT MCDOUGAL
Algebra & Trigonometry with Analytic Geometry
Algebra
ISBN:
9781133382119
Author:
Swokowski
Publisher:
Cengage
College Algebra
Algebra
ISBN:
9781305115545
Author:
James Stewart, Lothar Redlin, Saleem Watson
Publisher:
Cengage Learning