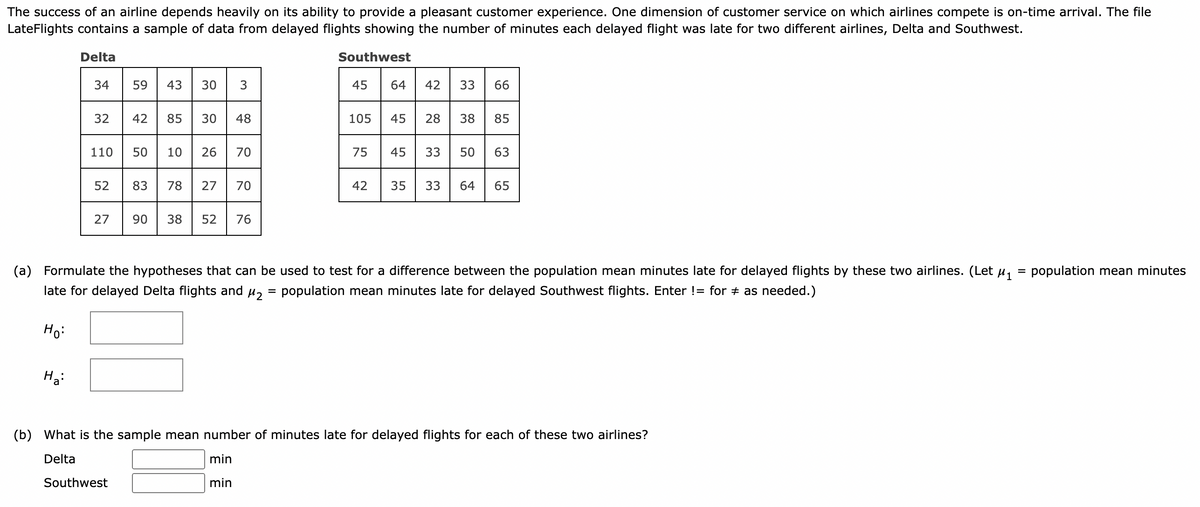
The success of an airline depends heavily on its ability to provide a pleasant customer experience. One dimension of customer service on which airlines compete is on-time arrival. The file LateFlights contains a sample of data from delayed flights showing the number of minutes each delayed flight was late for two different airlines, Delta and Southwest. Delta Southwest 34 59 43 30 3 32 42 85 30 48 110 50 10 26 70 H₂: 52 27 83 78 27 70 90 38 52 76 Southwest 45 105 45 28 38 85 45 33 50 63 35 33 64 65 75 64 42 33 66 42 (a) Formulate the hypotheses that can be used to test for a difference between the population mean minutes late for delayed flights by these two airlines. (Let #₁ = population mean minutes late for delayed Delta flights and #₂ = population mean minutes late for delayed Southwest flights. Enter != for as needed.) Ho: (b) What is the sample mean number of minutes late for delayed flights for each of these two airlines? Delta min min
The success of an airline depends heavily on its ability to provide a pleasant customer experience. One dimension of customer service on which airlines compete is on-time arrival. The file LateFlights contains a sample of data from delayed flights showing the number of minutes each delayed flight was late for two different airlines, Delta and Southwest. Delta Southwest 34 59 43 30 3 32 42 85 30 48 110 50 10 26 70 H₂: 52 27 83 78 27 70 90 38 52 76 Southwest 45 105 45 28 38 85 45 33 50 63 35 33 64 65 75 64 42 33 66 42 (a) Formulate the hypotheses that can be used to test for a difference between the population mean minutes late for delayed flights by these two airlines. (Let #₁ = population mean minutes late for delayed Delta flights and #₂ = population mean minutes late for delayed Southwest flights. Enter != for as needed.) Ho: (b) What is the sample mean number of minutes late for delayed flights for each of these two airlines? Delta min min

Glencoe Algebra 1, Student Edition, 9780079039897, 0079039898, 2018
18th Edition
ISBN:9780079039897
Author:Carter
Publisher:Carter
Chapter10: Statistics
Section10.6: Summarizing Categorical Data
Problem 27PPS

Related questions
Question
Transcribed Image Text:The success of an airline depends heavily on its ability to provide a pleasant customer experience. One dimension of customer service on which airlines compete is on-time arrival. The file
LateFlights contains a sample of data from delayed flights showing the number of minutes each delayed flight was late for two different airlines, Delta and Southwest.
Delta
34
Ha:
32
52
59 43 30 3
42 85 30
110 50 10 26 70
48
Southwest
83 78 27 70
27 90 38 52 76
Southwest
=
45
105
75
42
64
45
42 33 66
35
28 38 85
45 33 50 63
(a) Formulate the hypotheses that can be used to test for a difference between the population mean minutes late for delayed flights by these two airlines. (Let μ₁
late for delayed Delta flights and μ₂ population mean minutes late for delayed Southwest flights. Enter != for ‡ as needed.)
Ho:
33
64 65
(b)
What is the sample mean number of minutes late for delayed flights for each of these two airlines?
Delta
min
min
= population mean minutes
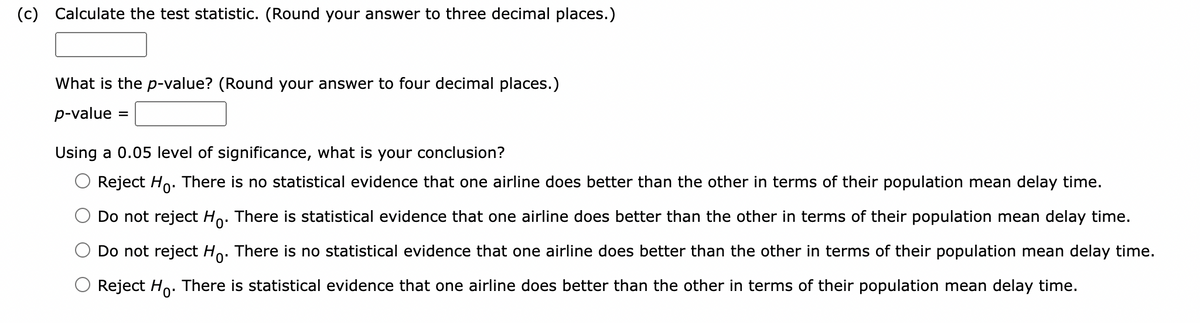
Transcribed Image Text:(c) Calculate the test statistic. (Round your answer to three decimal places.)
What is the p-value? (Round your answer to four decimal places.)
p-value
=
Using a 0.05 level of significance, what is your conclusion?
Reject Ho. There is no statistical evidence that one airline does better than the other in terms of their population mean delay time.
Do not reject Ho. There is statistical evidence that one airline does better than the other in terms of their population mean delay time.
Do not reject Ho. There is no statistical evidence that one airline does better than the other in terms of their population mean delay time.
Reject Ho. There is statistical evidence that one airline does better than the other in terms of their population mean delay time.
Expert Solution
This question has been solved!
Explore an expertly crafted, step-by-step solution for a thorough understanding of key concepts.

This is a popular solution!

Trending now
This is a popular solution!

Step by step
Solved in 2 steps with 7 images

Recommended textbooks for you
Glencoe Algebra 1, Student Edition, 9780079039897…
Algebra
ISBN:
9780079039897
Author:
Carter
Publisher:
McGraw Hill

Functions and Change: A Modeling Approach to Coll…
Algebra
ISBN:
9781337111348
Author:
Bruce Crauder, Benny Evans, Alan Noell
Publisher:
Cengage Learning

Holt Mcdougal Larson Pre-algebra: Student Edition…
Algebra
ISBN:
9780547587776
Author:
HOLT MCDOUGAL
Publisher:
HOLT MCDOUGAL
Glencoe Algebra 1, Student Edition, 9780079039897…
Algebra
ISBN:
9780079039897
Author:
Carter
Publisher:
McGraw Hill
Functions and Change: A Modeling Approach to Coll…
Algebra
ISBN:
9781337111348
Author:
Bruce Crauder, Benny Evans, Alan Noell
Publisher:
Cengage Learning
Holt Mcdougal Larson Pre-algebra: Student Edition…
Algebra
ISBN:
9780547587776
Author:
HOLT MCDOUGAL
Publisher:
HOLT MCDOUGAL