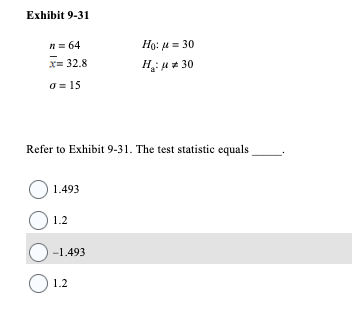
Refer to Exhibit 9-31. The test statistic equals O 1.493 1.2 O-1.493 O 1.2


Q: List the possible remainders when the positive integer n is divided by 7.
A: We have to calculate possible remainders when the positive integer n is divided by 7
Q: Q4. Suppose that the daily miles driven by a trucking company is normally distributed with a mean of…
A:
Q: Given a data set consisting of 33 unique whole number observations, its five-number summary is:…
A: given data,data set consisiting of 33 unique whole number observations its five number summry is…
Q: What is the importance of mathematics in your/our life
A:
Q: College students are randomly selected and arranged in groups of three. The random variable x is the…
A:
Q: dread proportion 1 0.158 2 0.407 3 0.310 4 0.088 5 0.037 Total 1 Calculate the sample mean of the…
A: From the provided information, dread (x) proportion (p(x)) 1 0.158 2 0.407 3 0.310 4…
Q: Let A denote the event of placing a $1 straight bet on a certain lottery and winning. Suppose that,…
A: General formula of probability is , Probability =Number of favorable outcomes Total outcomes
Q: E (XY)=E (X)E (Y) if x and y are independent. True b. False O a. O
A: The expectation of a discrete random variable X is a measure of central tendency of the probability…
Q: You run a call center and you need to determine the typical length of a technical support call to…
A: “Since you have posted a question with multiple sub-parts, we will solve the first three sub-parts…
Q: The manager of a grocery store has taken a random sample of 36 customers. The average length of time…
A: It is given that Sample size n = 36 Sample mean = 4.2 Population SD = 0.4
Q: IV. Normal Distribution and its Application. A. Find the indicated area under normal curve, then…
A: We will use Excel to find the area under Standard Normal curve. Note : According to our guidelines…
Q: Suppose you measure many many heights and get the following histograms Histogram of Height X Top…
A:
Q: Smokers at a company were invited to participate in a smoking cessation program, and were randomly…
A: Contingency table are used to measure the similarity and dissimilarity between the group of data…
Q: K A standard deck of cards contains 52 cards. One card is selected from the deck. (a) Compute the…
A:
Q: The distribution of the amount of money spent by students on textbooks in a semester is…
A:
Q: IELTS Scores Table A Class B Class 560 494 546 483 581 528 531 550 570 506 537 483 557 526 570 526…
A: Given data: A Class B Class 560 494 546 483 581 528 531 550 570 506 537 483 557 526…
Q: (b) Find the mean and standard deviation of the population of all possible sample means when we…
A: (b) The population mean is 6 and population standard deviation is 2.24. The mean of the population…
Q: Refer to the figure below in which surge protectors p and q are used to protect an expensive…
A: * SOLUTION :- Given that , The p and q are two surge protectors The probability of working each…
Q: Suppose 2000 students did an exam so the list of 2000 exam marks is a quantitative variable X. Also…
A:
Q: K Use the pie chart at the right, which shows the number of workers (in thousands) by industry for a…
A: P(Worker not employed in Agriculture forestry, fishing, and hunting) = 0.981 Explanation:
Q: The accompanying table lists probabilities for the corresponding numbers of unlicensed software…
A: Number of unlicensed software packages x p(x) 0 0.125 1 0.375 2 0.375 3 0.125
Q: Compute the correlation coefficient (r) of consumption and price
A: Given data: Consumption Price 0.386 1.35 0.474 1.5 0.393 1.39 0.425 1.49 0.406 1.36…
Q: a. What is your probability of winning? The probability of winning is. (Type an integer or a…
A: There is 13 odds numbers between 1 to 28
Q: 8 6 Frequency A N 16 21 26 31 data Based on the histogram above, what is the class width? 1 6 Class…
A:
Q: Suppose the total weight of passengers on a particular flight has a mean of 1499 with standard…
A: Let X be the random variable from normal distribution with mean (μ) = 1499, standard deviation (σ) =…
Q: =y 3 5
A: The given data is Low Temperature Frequency 40-44 3 45-49 5 50-54 9 55-59 4 60-64 1
Q: Here is a data set summarized as a stem-and-leaf plot: Stem Leaf 6 1 2 2 3 4 9 7 2 2 2 2 4 9 9 8 4…
A: The stem and Leaf plot is given.
Q: Consider the following data: {17, 14, 20, 18, 11} a) Find the sample mean of this data. b) Find the…
A: Given data is 17,14,20,18,11sample size(n)=5
Q: eview the table labeled Figure 3: Car Dataset Used By Police Force. Attribute A shows if a car was…
A: The attribute B shows if a car has a plate number and class attribute shows if a car was stolen.
Q: As part of the United States Department of Agriculture's Super Dump Cleanup in the early 2000s,…
A: Given information: X 3.4 4 5.6 3.7 8 5.5 5.3 4.2 4.3 7.3 8.6 5.1 8.7…
Q: Year 2004 2005 2006 2007 2008 Consumer Credit 2210.5 2319.8 2415.0 2551.9 2592.1 Year 2009 2010 2011…
A: “Since you have posted a question with multiple sub-parts, we will solve first three subparts for…
Q: and its A. Find the indicated area under normal curve, then convert it to percentage.(. Between 0…
A: P(Z>2.23)=? P(Z>-1.51)=? P(Z>-0.78)=? Note: According to Bartleby guidelines expert…
Q: A batch of 2000 manufactured Items contains 200 defective items.If 10 items are selected at random…
A: From the provided information, A batch of 2000 manufactured items contain 200 defective items.…
Q: Suppose the profit from 1000 plays of a poker machine is normally distributed with mean 3.7 and…
A: Given that Population mean=3.7 Standard deviation =1.8 For 2.28th Percentile we have to find which…
Q: Historically, in Australia 84% of customers select that parcels may be left at the front door if…
A: The question is about sampling dist. of proportion Given : Prop. of customers selects that parcels…
Q: When you knit something using a pattern, each line of the pattern contains a stitch count. Depending…
A: Given that, When we knit something using a pattern, each line of the pattern contains a stitch…
Q: Identify two types of variables and four scales of measurement. How they are related with each…
A: Variables: In statistics, variable is defined as an entity which may takes different values. It…
Q: The temperature of a liquid during the first four minutes of an experiment has been recorded in the…
A: Residual is the error occurred in the data set. It is calculated by subtracting the actual and the…
Q: A multiple-choice examination consists of 85 questions, each having possible choices a, b, c, and d.…
A: Let X be the number of correct answers. Given: Trials, n=85 Random variable,x=22 Probability of…
Q: Determine whether the value is a discrete random variable, continuous random variable, or not a…
A: Definition Not random variable ( if data is not countable means if we are unable to get probability)…
Q: R5.34. AP statistics scores 2016 In 2016, about 200,000 statistics students nationwide took the…
A: The given data: To validate the claim that if the discrepancy between the theoretical distribution…
Q: tion of a ce 101 The estimated percent dis 125 15 chart. Find the probability of each event listed…
A: given data,the estimated percent distribution of a certain country's population for 2025 is shown…
Q: levels since 1959. At that time, there were 319 parts per million of carbon dioxide in the…
A: Given: In 1959, the figure was 319 parts per million of carbon dioxide in the atmosphere. In 2005,…
Q: bank manager is interested in the average length of time that customers are willing to wait in line…
A: Introduction : Statistic : A quantity which is obtained from sample. It is a numerical measure of a…
Q: Introduction of Statistics. Write the answer before each item. 1. A branch of mathematics that deals…
A: Hi! Thank you for the question, As per the honor code, we are allowed to answer three sub-parts at a…
Q: If S = {0, 1, 2, 3, 4, 5, 6, 7, 8, 9}, and A = {0, 2, 4, 6, 8}, B = {1, 3, 5, 7, 9}, C = {4, 5, 6,…
A: S = {0, 1, 2, 3, 4, 5, 6, 7, 8, 9}, and A = {0, 2, 4, 6, 8}, B = {1, 3, 5, 7, 9}, C = {4, 5, 6, 7},…
Q: An insurance company crashed four cars of the same model at 5 miles per hour. The costs of repair…
A:
Q: Hello please help me with the statistics problem as I am very confused. I have attached the file…
A: Introduction: It is required to present the data in the suggested format, and obtain the relative…
Q: Which pairs of events are complementary? 1: the component is reliable 2: there is only one component…
A: A pair of occurrences is said to be complimentary if and only if one of them happens while the other…
Q: Suppose a survey conducted in 2012 asked a group of adults from a certain country whether they drink…
A: We define the sample statistics as: A sample statistic is a numerical measure of a sample. A…

Step by step
Solved in 2 steps

- A piece is to be cut to the dimensions and tolerances shown in Figure 29-14. Determine the maximum permissible value of length A. All dimensions are in inches.Consider the PI: 21 < Xnew < 34. Is 41 a plausiblevalue for the next X measurement? Explain.the highest data of 50 leaves is 150mm and the lowest is 118m the desired class size is 9
- Samples of emissions from three suppliers are classified for conformance to air-quality specifications. The results from 100 samples are summarized as follows I need a step-by-step solution and an explanation. Thank you!(Only part 4 and 5 to be solved) A researcher was interested in studying if there is a significant relationship between the severity of COVID 19 and blood types of individuals. 2400 individuals were studied and the results are shown below. Condition Blood Type O A B AB Total Critical 64 44 20 8 136 Severe 175 129 50 15 369 Moderate 211 528 151 125 1015 Mild 200 400 140 140 880 Total 650 1101 361 288 2400 State both the null and alternative hypotheses. Provide the decision rule for making this decision. Use an alpha level of 5%. Show all of the work necessary to calculate the appropriate statistic. What conclusion are you allowed to draw? (to be solved) . Would your conclusion change at the 10% level of significance? (to be solved)Out of 1000 residents of Eagle County surveyed, 590 of them feel that their children receive a good education. Out of 1000 residents of Beaver County surveyed, 840 of them feel that their children receive a good education. The two samples were collected independently. Based on the sample data, calculate a 95% CI for the difference between the two proportions who feel their children receive a good education. Round you answer to 3 decimal places. What conclusion can you draw? (-0.258,-0.242) No conclusion (-0.288,-0.212) Group 2 is bigger (0.223,0.278) Group 2 is bigger (-0.258,-0.242) Group 2 is bigger (0.223,0.278) Group 1 is bigger
- An observer at a busy bus stop did a 30-minute study of 3 buses. Given the following -Alight time =2 sec -Board time=3 sec -Door opening time =5 sec Determine the number of passengers alighting from the back door for the 3 busesItem 9 At a research facility that designs rocket engines, researchers know that some engines fail to ignite as a result of fuel system error. From a random sample of 40 engines of one design, 14 failed to ignite as a result of fuel system error. From a random sample of 30 engines of a second design, 9 failed to ignite as a result of fuel system error. The researchers want to estimate the difference in the proportion of engine failures for the two designs. Which of the following is the most appropriate method to create the estimate? A one-sample z-interval for a sample proportion A A one-sample z-interval for a population proportion B A two-sample z-interval for a population proportion C A two-sample z-interval for a difference in sample proportions D A two-sample z-interval for a difference in population proportionsA woman is told that her weight has a standard score (\\( z \\)‑score) of \\( −1.5 . \\) This means that:
- Since the z score for the tallest man is z= __________and the z score for the shortest man is z=___________, the tallest or shortest man had the height that was more extreme. (Round to two decimal places.)During the morning of August 14, 2011, Old Faithful Geyser in Yellowstone National Park erupted at the following times (to the nearest minute): 12:07 a.m., 1:42 a.m., 3:05 a.m., 4:41 a.m., 6:07 a.m., 7:37 a.m., 9:08 a.m., and 10:34 a.m. What was the average interval between eruptions on this morning? _____ minutesBased on the descriptions of the four levels of measurements, classify each of the variables listed below whether it is nominal, ordinal, interval, or ratio. Write your answer in the corresponding cell in the table that follows.


