The Survey of Study Habits and Attitudes (SSHA) is a psychological test that measures the motivation, attitudes, and study habits of college students. Scores range from 0 to 200 and follow, approximately, a Normal distribution, with mean of 110 and standard deviation o 20. You suspect that incoming freshman have a mean u that is different from 110, because they are often excited yet anxious about entering college. To verify your suspicion, you test the hypotheses Ho : u = 110, Ha: µ + 110. You give the SSHA to 50 students who are incoming freshman and find their mean score. The P-value of the test of the null hypothesis is: the probability, assuming the null hypothesis is false., that the test statistic will take a value at least as extreme as that actually observed. the probability, assuming the null hypothesis is true, that the test statistic will take a value at least as extreme as that actually observed.
The Survey of Study Habits and Attitudes (SSHA) is a psychological test that measures the motivation, attitudes, and study habits of college students. Scores range from 0 to 200 and follow, approximately, a Normal distribution, with mean of 110 and standard deviation o 20. You suspect that incoming freshman have a mean u that is different from 110, because they are often excited yet anxious about entering college. To verify your suspicion, you test the hypotheses Ho : u = 110, Ha: µ + 110. You give the SSHA to 50 students who are incoming freshman and find their mean score. The P-value of the test of the null hypothesis is: the probability, assuming the null hypothesis is false., that the test statistic will take a value at least as extreme as that actually observed. the probability, assuming the null hypothesis is true, that the test statistic will take a value at least as extreme as that actually observed.

Glencoe Algebra 1, Student Edition, 9780079039897, 0079039898, 2018
18th Edition
ISBN:9780079039897
Author:Carter
Publisher:Carter
Chapter10: Statistics
Section10.4: Distributions Of Data
Problem 19PFA

Related questions

Question
100%
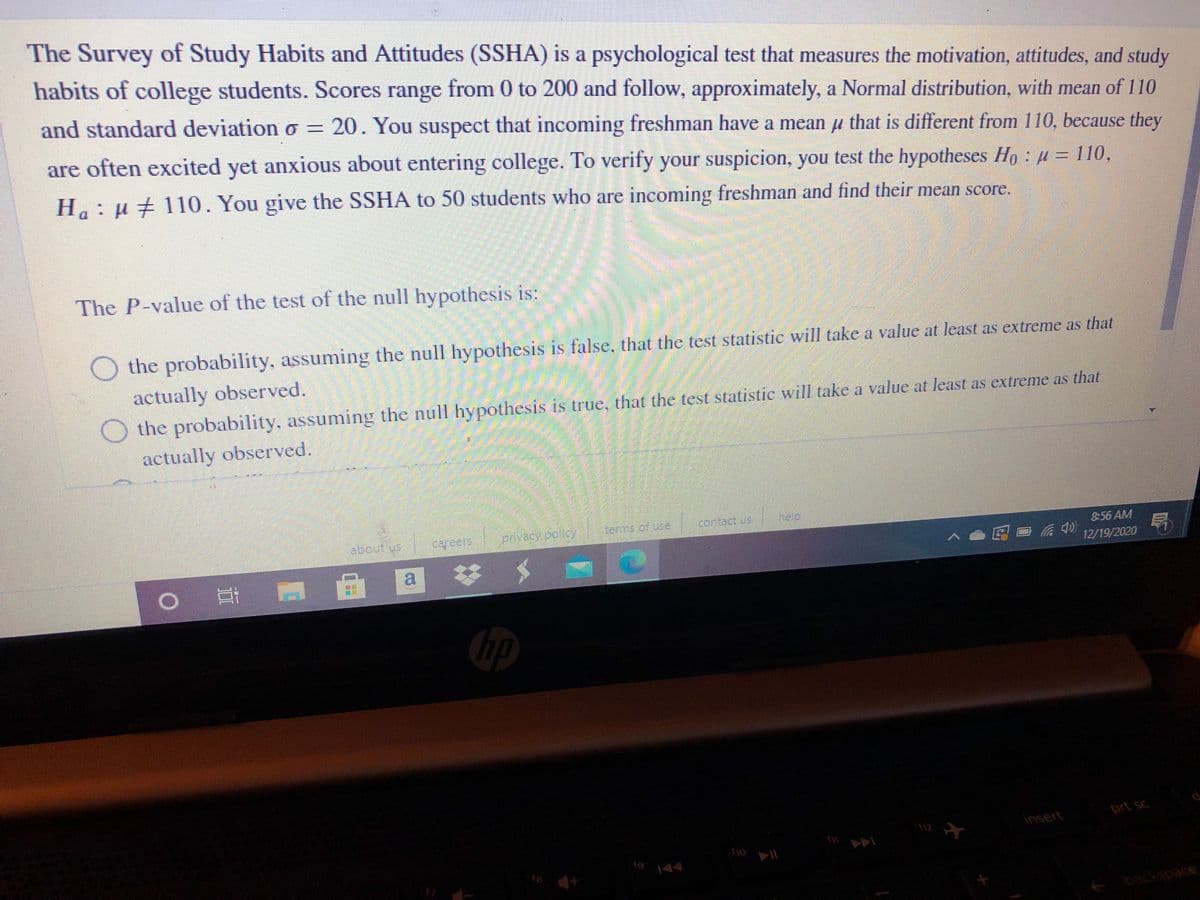
Transcribed Image Text:The Survey of Study Habits and Attitudes (SSHA) is a psychological test that measures the motivation, attitudes, and study
habits of college students. Scores range from 0 to 200 and follow, approximately, a Normal distribution, with mean of 110
and standard deviation o = 20. You suspect that incoming freshman have a mean u that is different from 110, because they
are often excited yet anxious about entering college. To verify your suspicion, you test the hypotheses Ho: u= 110,
H: u+110. You give the SSHA to 50 students who are incoming freshman and find their mean score.
D.
The P-value of the test of the null hypothesis is:
the probability, assuming the null hypothesis is false, that the test statistic will take a value at least as extreme as that
actually observed.
O the probability, assuming the null hypothesis is true, that the test statistic will take a value at least as extreme as that
actually observed.
temms ofuse
contact us
help
about us
cafeers
856 AM
12/19/2020
a
hp
prt sc
112
insert
f9
144
f8
f7
Transcribed Image Text:"ypouk
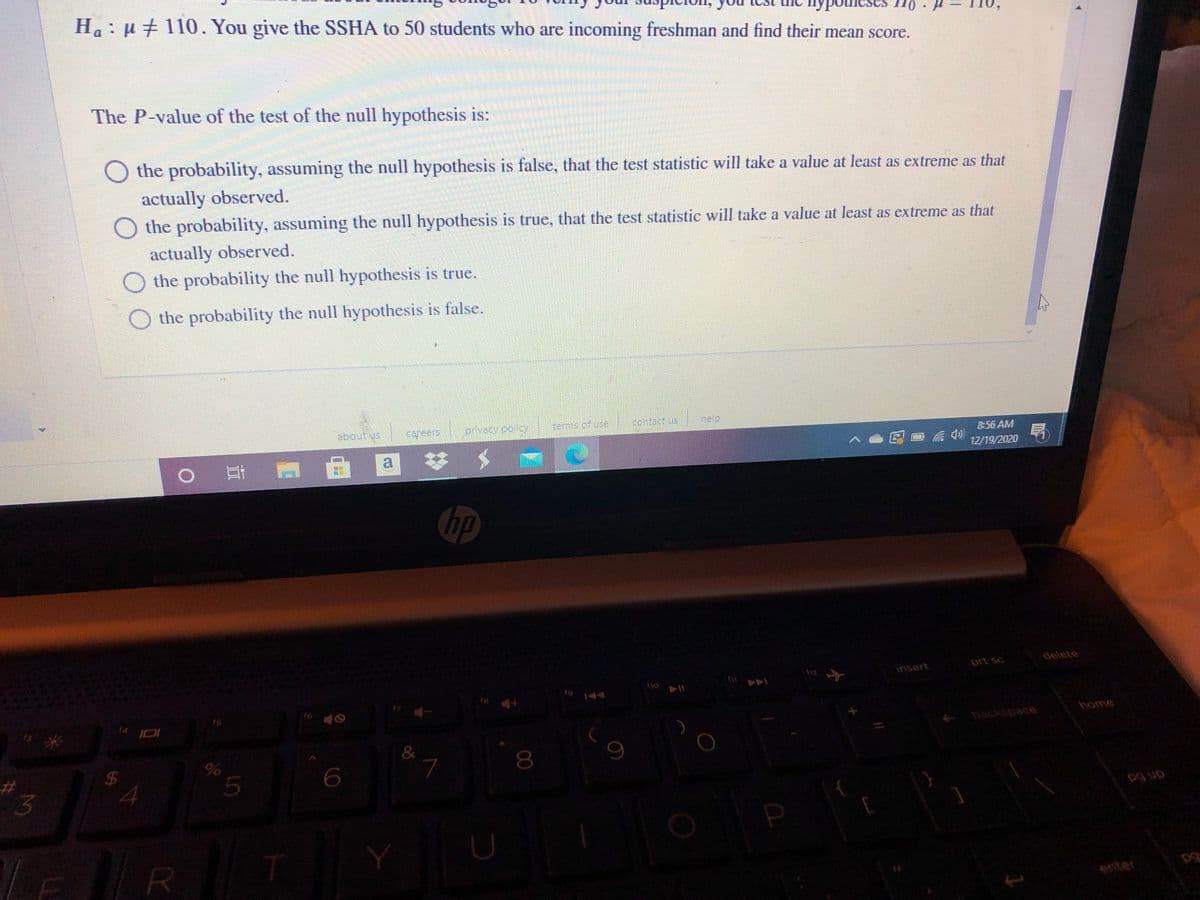
Ha: µ +110. You give the SSHA to 50 students who are incoming freshman and find their mean score.
The P-value of the test of the null hypothesis is:
O the probability, assuming the null hypothesis is false, that the test statistic will take a value at least as extreme as that
actually observed.
O the probability, assuming the null hypothesis is true, that the test statistic will take a value at least as extreme as that
actually observed.
the probability the null hypothesis is true.
the probability the null hypothesis is false.
cayeers
privacy po cy
ferms of ude
contact us
help
856 AM
12/19/2020
hp
delete
prt sc
112
insert
t9
fe
一▲在
114 O11
home
&
8
3.
in 6d
R
enter
%24
Expert Solution
This question has been solved!
Explore an expertly crafted, step-by-step solution for a thorough understanding of key concepts.

This is a popular solution!

Trending now
This is a popular solution!

Step by step
Solved in 2 steps

Knowledge Booster


Learn more about
Need a deep-dive on the concept behind this application? Look no further. Learn more about this topic, statistics and related others by exploring similar questions and additional content below.Recommended textbooks for you
Glencoe Algebra 1, Student Edition, 9780079039897…
Algebra
ISBN:
9780079039897
Author:
Carter
Publisher:
McGraw Hill
Glencoe Algebra 1, Student Edition, 9780079039897…
Algebra
ISBN:
9780079039897
Author:
Carter
Publisher:
McGraw Hill