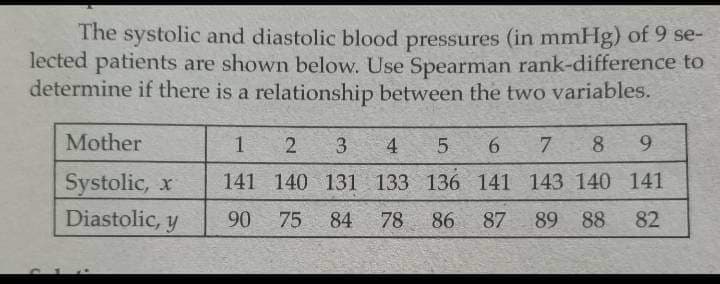
The systolic and diastolic blood pressures (in mmHg) of 9 se- lected patients are shown below. Use Spearman rank-difference to determine if there is a relationship between the two variables. Mother 3. 4 7 8 9 . Systolic, x 141 140 131 133 136 141 143 140 141 Diastolic, y 90 75 84 78 86 87 89 88 82
Q: Because elderly people may have difficulty standing to have their height measured, a study looked at…
A: Note: Hi there! Thank you for posting the question. As there are multiple sub parts, according to…
Q: 2. Anxiety level and average grade of selected grade 11 students. Anxiety level 2 3 5 7 GPA 95 92 91…
A: The scatter plot can be obtained using EXCEL software. Enter the values of English in column A and…
Q: 1. English and Science grades of five science club officers. English grade 80 80 85 Science grade 80…
A: Note: Hi, thank you for the question. As per our company guideline we are supposed to answer only…
Q: Which of the following statements regarding the widths of bars in a histogram is true? O a. Widths…
A: Number of bins are the interval that contains a particular range of data within that interval.
Q: physician wishes to know whether there is a relationship between a father’s weight (in pounds) and…
A: Given A data table is given.we need to answer the following questions. Please find the below…
Q: Data 24 132 156 95 57 173 155 45 134 Question1 xbar Question 2 Question 3 medan median Click to…
A: The xbar for the given data in the question represents the mean of the data.The formula to calculate…
Q: The following table gives information on the average saturated fat (in grams) consumed per day and…
A: (c ) Use EXCEL to construct the scatter plot. EXCEL procedure: Go to EXCEL Go to Insert menu…
Q: A student poll measured the following variable on LMU students: Commuter Status (Yes/No) Is this…
A: Commuter Status is a quality, so it is a qualitative variable.
Q: A pediatrician wants to determine the relation that may exist between a child's height and head…
A: Step-by-step procedure to find the regression line using Excel: In Excel sheet, enter x and y in…
Q: A researcher wants to determine if there is a linear relationship between the magnitudes of…
A: Given Magnitude x 7.7 6.7 6.9 6.8 4.0 3.8 7.1 5.9 Depth y 35 18 17 26 5 10 25 10
Q: Part 1 of 4 Can we infer a students score on their final exam based on how many class meetings they…
A:
Q: Given the table below representing IQ (x) and GPA (y), find the equation of the line that best fits…
A: Thanks for the question. For the given data values, the correct regression equation is y=0.04x-1.35.…
Q: a survey conducted by a reputable marketing agency,257 of 1000 adults 19 years of age or older…
A: It is given that 257 of 1000 adults 19 year of age or older confessed to bringing.
Q: Which of the following descriptions best and most completely describes the relationship variables…
A: The scatterplot is given. Scatterplot shows association between two variables.
Q: 1. The following histogram represents the number of pages in each book within a collection. What is…
A: MCQs
Q: 2) Steve wanted to see whether there was any relationship between the temperature when he leaves for…
A: As per our guidelines, we are allowed to answer first three sub-parts only. Thanks Given Data :…
Q: The height (sidewalk to roof) of notable tall buildings in America is compared to the number of…
A: Hey, since there are multiple subparts posted, we will answer first three subparts. If you want any…
Q: Which set of data represents an inverse variation? A y 4 10 %3B 1.5 3 y 2.5 1.5 C 10 20 25 y 0.1 0.5…
A:
Q: he following histogram represents the number of pages in each book within a collection. What is the…
A: 1) The histogram represents the number of pages in each book within a collection.
Q: following two-way table. Female Male Total 10 42 7 19 45 108 In a relationship 32 It's complicated…
A: female male total in relationship 32 10 42 its complicated 12 7 19 single 63 45 108…
Q: Here is a bivariate data set. y 26.3 69.6 71.6 91.9
A: Given information, x y x^2 y^2 xy 26.3 69.6 691.69 4844.16 1830.48 71.6 91.9 5126.56 8445.61…
Q: Given the following data, do the tasks stated below. a) Identify the independent variable and the…
A: Hey, since there are multiple subparts posted, we will answer first three subparts. If you want any…
Q: The data below represent the number of wins by 11 major league baseball teams and the team ERA. The…
A: Note: Hi! Thank you for the question. As you have posted multiple sub-parts, we have helped you…
Q: Which of the following pairs of variables is likely to have a negative correlation. the square…
A: The square footage of a home and its price Positive, As home footage increase the price of house…
Q: Given the following pairs of value of the variables: Advertisement expenses and revenue generation…
A:
Q: The table below shows the number of state-registered automatic weapons and the murder rate for…
A: y = 0.88 x + 3.76 Answer A: X = 4.8 thousand automatic weapons y = 0.88 (4.8) + 3.76 y = 7.984…
Q: Given are five observations for two variables, x and y. I| 3 12 6 20 14 y. | 55 40 55 10 15 a.…
A:
Q: A real estate agent wanted to find the relationship between sale price of houses and the size of the…
A: Note:-Since you have posted a question with multiple sub-parts, we will solve first three sub-parts…
Q: If frequency of an item a is given as 9, and total number of items in the collected data is 40; then…
A:
Q: 257 20- 15- 10- 5- 40 45 50 55 60 85 70 75 80 85 95 100 105 110 115 120 125 130 OK Frequency
A: Here first we take a values from histogram. And then we…
Q: A doctor wanted to determine whether there is a relation between a male's age and his HDL…
A: Hello. Since your question has multiple sub-parts, we will solve first three sub-parts for you. If…
Q: Do the data shown below indicate that there is a statistically significant linear relationship…
A: There is always some contention about the value of a parameter or the relationship between…
Q: 1) An emergency service wishes to see whether a relationship exists between the outside temperature…
A: a) Scatter plot: Steps to construct scatter plot in Excel: Enter the data for x and y in Excel…
Q: The following data was taken from Mr. Martin's math class. Which choice BEST describes the…
A: In the graph, it shows the student who study more have higher chances to get good score. The test…
Q: The table below shows the number of absences in a class and the final exam grade of 7 randomly…
A: Use the SPSS and perform correlation test. Following are the steps to perform correlation test. 1)…
Q: During one year, the numbers of motorcycle accidents in a certain country were tabulated by day of…
A: The answer is attached below,
Q: (b) Draw a side-by-side bar chart to describe the data. I Cell Phone No Cell Phone Trequency 10…
A: Bar chart is used to compare the counts ( frequency) , the means , or other summary statistics using…
Q: A survey taken in a hotel shows the number of cups of coffee consumed with each meal.Find the…
A: Option (b) is correct.
Q: A researcher desires to know whether the typing speed of a secretary (in words per minute) is…
A: To find the correlation coefficient and the regression equation the following steps are performed in…
Q: 14. The following table gives the miles per gallon and the load capacity for 6 SUV's. Miles per…
A: Introduction: The miles per gallon of a vehicle is a measure of its mileage, while its load capacity…
Q: 4- The fuel tank capacity in gallons and the cruising range is given for 6 SUV's. a. Develop a…
A: (a) Use EXCEL to construct the scatter plot. EXCEL procedure: Go to EXCEL Go to Insert menu…
Q: Which equation most closely represents the line of best fit for the scatter plot below? Money Earned…
A: Here we the given options to get the required equation.
Q: Given the following pairs of value of the variables: Advertisement expenses and revenue generation…
A: “Since you have posted a question with multiple sub-parts, we will solve first three subparts for…
Q: The relationship between study hours and exam score was estimated as below in a linear format.…
A: the linear regression model of exam score and study hours are given below . Exam score = 6.24 *…
Q: 4. From the data given below, find out the value of Y when X 35 10 20 30 40 50 60 70 90
A: Given the table X Y 10 50 20 60 30 70 40 90 Here, we are going to use the linear…
Q: Find the relationship between the two variables in the given data. 1 2 3 4 y 20 16 12 8
A: The given data is x 1 2 3 4 y 20 16 12 8
Q: The ages (in years) and heights (in inches) of all pitchers for a baseball team are listed. Find…
A: The coefficient of variation formula is, CV = (s/x̅) × 100%, where x̅ is the sample mean and s is…
Q: 6. The table below shows the relationship between Sustained Winds (x) and Storm pressure ((y) for…
A: Definition used - Function - Function is a type of relation in which each input has a…
Q: A doctor wanted to determine whether there is a relation between a male's age and his HDL…
A: a) Excel Procedure: Enter X and Y data in Excel>Data>Data Analysis> ‘Regression’>Select…
compute the given below using the
Step by step
Solved in 2 steps