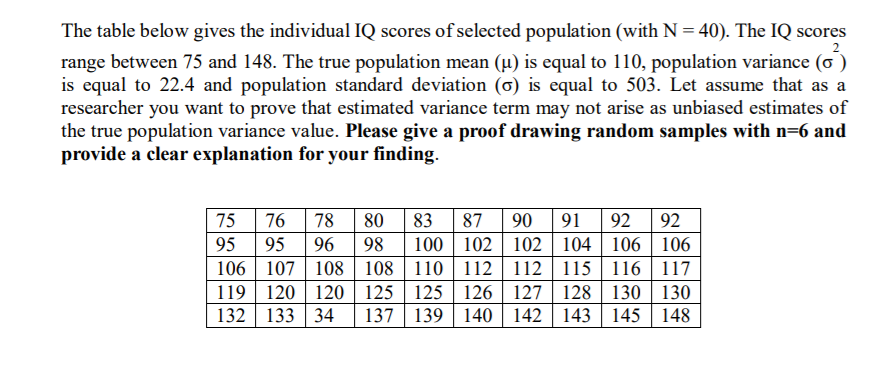
The table below gives the individual IQ scores of selected population (with N = 40). The IQ scores range between 75 and 148. The true population mean (u) is equal to 110, population variance (o ) is equal to 22.4 and population standard deviation (6) is equal to 503. Let assume that as a researcher you want to prove that estimated variance term may not arise as unbiased estimates of the true population variance value. Please give a proof drawing random samples with n=6 and provide a clear explanation for your finding. 75 76 78 80 83 87 90 91 92 92
The table below gives the individual IQ scores of selected population (with N = 40). The IQ scores range between 75 and 148. The true population mean (u) is equal to 110, population variance (o ) is equal to 22.4 and population standard deviation (6) is equal to 503. Let assume that as a researcher you want to prove that estimated variance term may not arise as unbiased estimates of the true population variance value. Please give a proof drawing random samples with n=6 and provide a clear explanation for your finding. 75 76 78 80 83 87 90 91 92 92

MATLAB: An Introduction with Applications
6th Edition
ISBN:9781119256830
Author:Amos Gilat
Publisher:Amos Gilat
Chapter1: Starting With Matlab
Section: Chapter Questions
Problem 1P

Related questions

Question
can you help the question attached
Transcribed Image Text:The table below gives the individual IQ scores of selected population (with N = 40). The IQ scores
range between 75 and 148. The true population mean (µ) is equal to 110, population variance (o )
is equal to 22.4 and population standard deviation (6) is equal to 503. Let assume that as a
researcher you want to prove that estimated variance term may not arise as unbiased estimates of
the true population variance value. Please give a proof drawing random samples with n=6 and
provide a clear explanation for your finding.
80 83
100 | 102
106 107 108 | 108 | 110 | 112 | 112 | 115 | 116 | 117
119 120 | 120 | 125 | 125 126 | 127 | 128 | 130 | 130
90
76
95
75
78
87
91
92
92
95
96
98
102 104 | 106 | 106
132 133 34
137 139 140 | 142 | 143 145 148
Expert Solution
This question has been solved!
Explore an expertly crafted, step-by-step solution for a thorough understanding of key concepts.

Step by step
Solved in 3 steps

Knowledge Booster


Learn more about
Need a deep-dive on the concept behind this application? Look no further. Learn more about this topic, statistics and related others by exploring similar questions and additional content below.Recommended textbooks for you
MATLAB: An Introduction with Applications
Statistics
ISBN:
9781119256830
Author:
Amos Gilat
Publisher:
John Wiley & Sons Inc

Probability and Statistics for Engineering and th…
Statistics
ISBN:
9781305251809
Author:
Jay L. Devore
Publisher:
Cengage Learning

Statistics for The Behavioral Sciences (MindTap C…
Statistics
ISBN:
9781305504912
Author:
Frederick J Gravetter, Larry B. Wallnau
Publisher:
Cengage Learning
MATLAB: An Introduction with Applications
Statistics
ISBN:
9781119256830
Author:
Amos Gilat
Publisher:
John Wiley & Sons Inc
Probability and Statistics for Engineering and th…
Statistics
ISBN:
9781305251809
Author:
Jay L. Devore
Publisher:
Cengage Learning
Statistics for The Behavioral Sciences (MindTap C…
Statistics
ISBN:
9781305504912
Author:
Frederick J Gravetter, Larry B. Wallnau
Publisher:
Cengage Learning

Elementary Statistics: Picturing the World (7th E…
Statistics
ISBN:
9780134683416
Author:
Ron Larson, Betsy Farber
Publisher:
PEARSON

The Basic Practice of Statistics
Statistics
ISBN:
9781319042578
Author:
David S. Moore, William I. Notz, Michael A. Fligner
Publisher:
W. H. Freeman

Introduction to the Practice of Statistics
Statistics
ISBN:
9781319013387
Author:
David S. Moore, George P. McCabe, Bruce A. Craig
Publisher:
W. H. Freeman