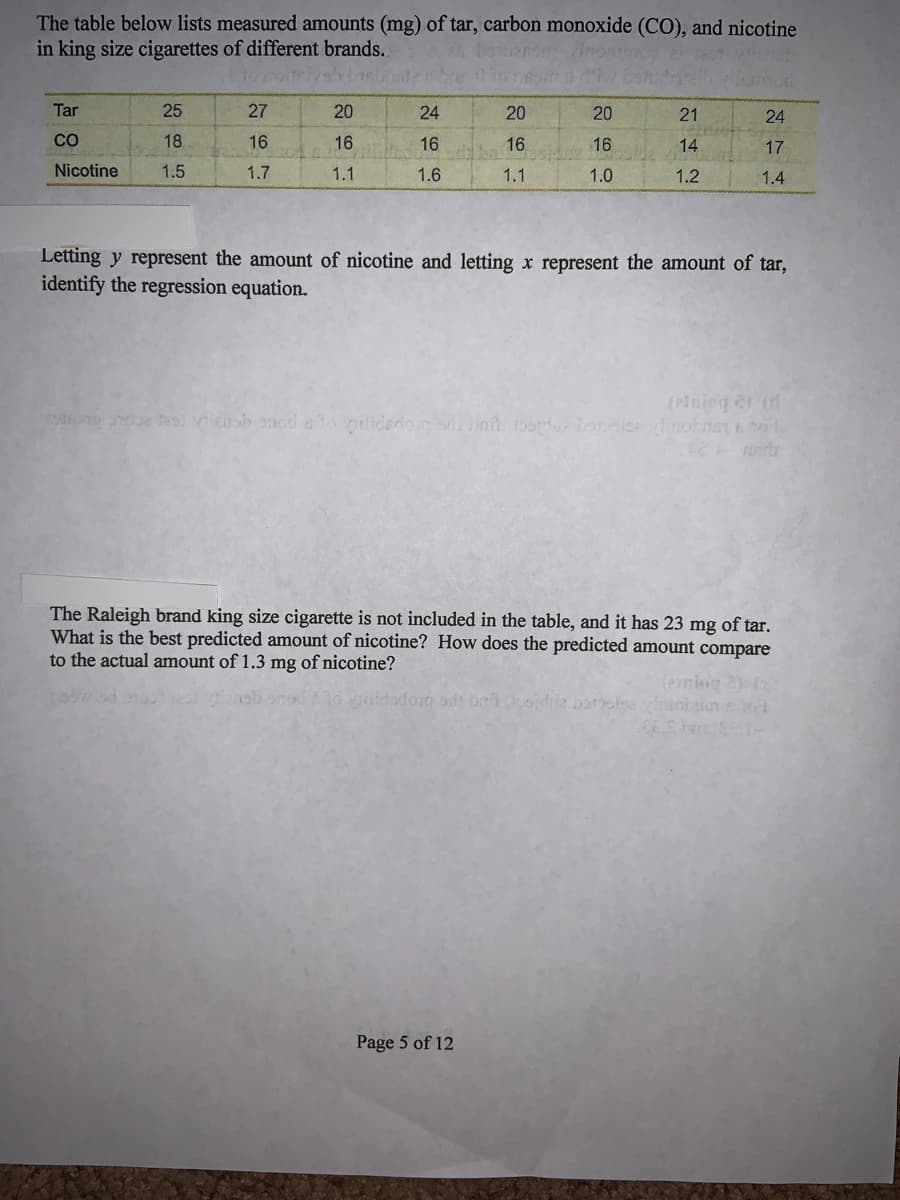
The table below lists measured amounts (mg) of tar, carbon monoxide (CO), and nicotine in king size cigarettes of different brands. s nos Tar 25 27 20 24 20 20 21 24 CO 18 16 16 16 16 16 14 17 Nicotine 1.5 1.7 1.1 1.6 1.1 1.0 1.2 1.4
The table below lists measured amounts (mg) of tar, carbon monoxide (CO), and nicotine in king size cigarettes of different brands. s nos Tar 25 27 20 24 20 20 21 24 CO 18 16 16 16 16 16 14 17 Nicotine 1.5 1.7 1.1 1.6 1.1 1.0 1.2 1.4

College Algebra
7th Edition
ISBN:9781305115545
Author:James Stewart, Lothar Redlin, Saleem Watson
Publisher:James Stewart, Lothar Redlin, Saleem Watson
Chapter1: Equations And Graphs
Section: Chapter Questions
Problem 10T: Olympic Pole Vault The graph in Figure 7 indicates that in recent years the winning Olympic men’s...

Related questions
Question

Transcribed Image Text:The table below lists measured amounts (mg) of tar, carbon monoxide (CO), and nicotine
in king size cigarettes of different brands.
Tar
25
27
20
24
20
20
21
24
CO
18
16
16
16
16
16
14
17
Nicotine
1.5
1.7
1.1
1.6
1.1
1.0
1.2
1.4
Letting y represent the amount of nicotine and letting x represent the amount of tar,
identify the regression equation.
(2iaing er d
tes iensh sncd stonilidedo baft tosorde basice vinobnan o
The Raleigh brand king size cigarette is not included in the table, and it has 23 mg of tar.
What is the best predicted amount of nicotine? How does the predicted amount compare
to the actual amount of 1.3 mg of nicotine?
1o gidadort od baioidi2 barsla yinio
Page 5 of 12
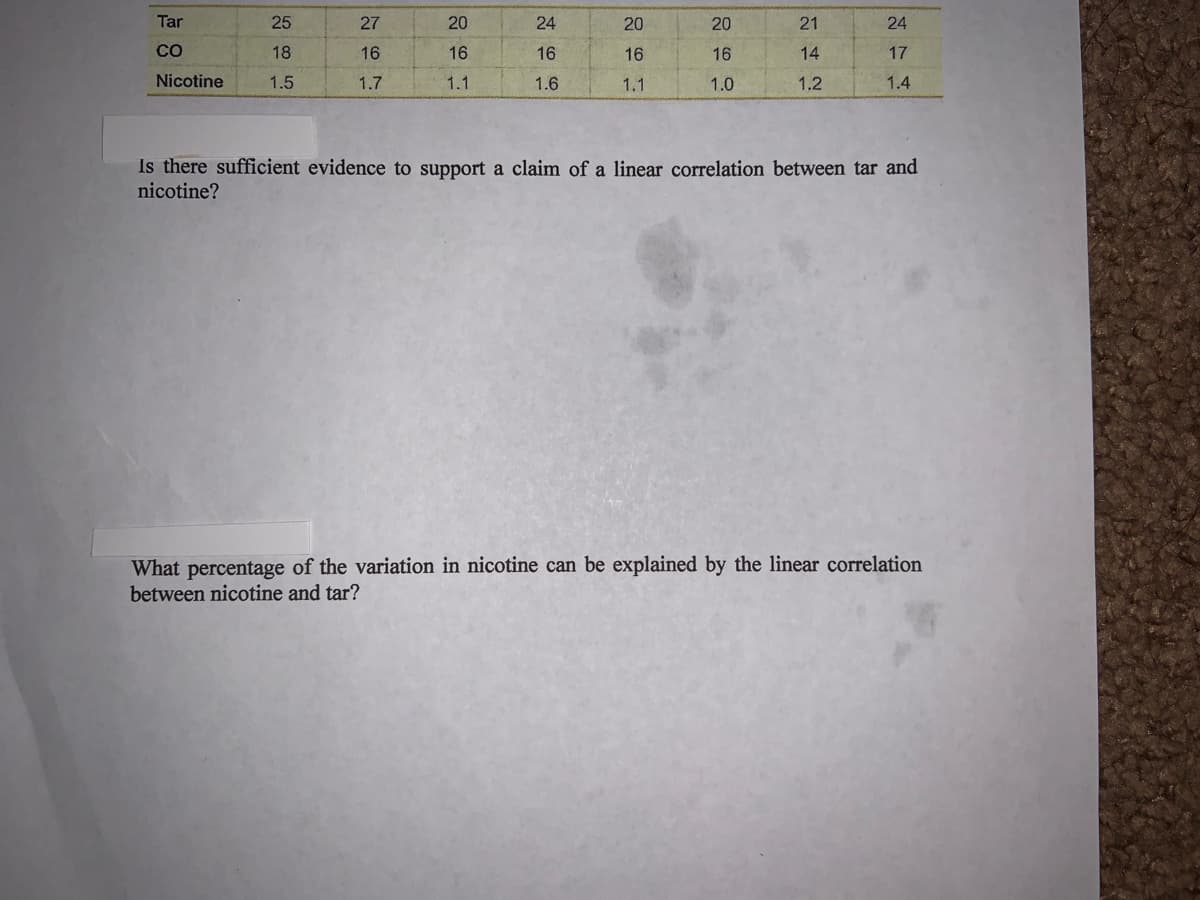
Transcribed Image Text:Tar
25
27
20
24
20
20
21
24
CO
18
16
16
16
16
16
14
17
Nicotine
1.5
1.7
1.1
1.6
1.1
1.0
1.2
1.4
Is there sufficient evidence to support a claim of a linear correlation between tar and
nicotine?
What percentage of the variation in nicotine can be explained by the linear correlation
between nicotine and tar?
Expert Solution
This question has been solved!
Explore an expertly crafted, step-by-step solution for a thorough understanding of key concepts.

This is a popular solution!

Trending now
This is a popular solution!

Step by step
Solved in 4 steps with 1 images

Knowledge Booster


Learn more about
Need a deep-dive on the concept behind this application? Look no further. Learn more about this topic, statistics and related others by exploring similar questions and additional content below.Recommended textbooks for you
College Algebra
Algebra
ISBN:
9781305115545
Author:
James Stewart, Lothar Redlin, Saleem Watson
Publisher:
Cengage Learning

Functions and Change: A Modeling Approach to Coll…
Algebra
ISBN:
9781337111348
Author:
Bruce Crauder, Benny Evans, Alan Noell
Publisher:
Cengage Learning

Glencoe Algebra 1, Student Edition, 9780079039897…
Algebra
ISBN:
9780079039897
Author:
Carter
Publisher:
McGraw Hill
College Algebra
Algebra
ISBN:
9781305115545
Author:
James Stewart, Lothar Redlin, Saleem Watson
Publisher:
Cengage Learning
Functions and Change: A Modeling Approach to Coll…
Algebra
ISBN:
9781337111348
Author:
Bruce Crauder, Benny Evans, Alan Noell
Publisher:
Cengage Learning
Glencoe Algebra 1, Student Edition, 9780079039897…
Algebra
ISBN:
9780079039897
Author:
Carter
Publisher:
McGraw Hill