An article in the ASCE Journal of Energy Engineering (1999, Vol. 125. pp. 59–75) describes a study of the thermal inertia properties of autoclaved aerated concrete used as a building material. Five samples of the material were tested in a structure, and the average interior temperatures (°C) reported were as follows: 23.01, 22.22, 22.04, 22.62,. and 22.59. Test that the average interior temperature is equal to 22.5 °C using a = 0.05. 18. This problem is a test on what population parameter? * Mean Variance/Standard Deviation Population Proportion 19. What is the null and alternative hypothesis * HO: (e = 22.5), H1: (@ = 22.5) HO: (0 = 22.5), H1: (0 > 22.5) HO: (0 = 22.5), H1: (0 < 22.5) 20. What are the Significance level and Type of test * O a = 0.05, Right-tailed O a = 0.05, left-tailed O a = 0.05, two-tailed
An article in the ASCE Journal of Energy Engineering (1999, Vol. 125. pp. 59–75) describes a study of the thermal inertia properties of autoclaved aerated concrete used as a building material. Five samples of the material were tested in a structure, and the average interior temperatures (°C) reported were as follows: 23.01, 22.22, 22.04, 22.62,. and 22.59. Test that the average interior temperature is equal to 22.5 °C using a = 0.05. 18. This problem is a test on what population parameter? * Mean Variance/Standard Deviation Population Proportion 19. What is the null and alternative hypothesis * HO: (e = 22.5), H1: (@ = 22.5) HO: (0 = 22.5), H1: (0 > 22.5) HO: (0 = 22.5), H1: (0 < 22.5) 20. What are the Significance level and Type of test * O a = 0.05, Right-tailed O a = 0.05, left-tailed O a = 0.05, two-tailed

Glencoe Algebra 1, Student Edition, 9780079039897, 0079039898, 2018
18th Edition
ISBN:9780079039897
Author:Carter
Publisher:Carter
Chapter10: Statistics
Section10.1: Measures Of Center
Problem 9PPS

Related questions
Question
PLS ANSWER
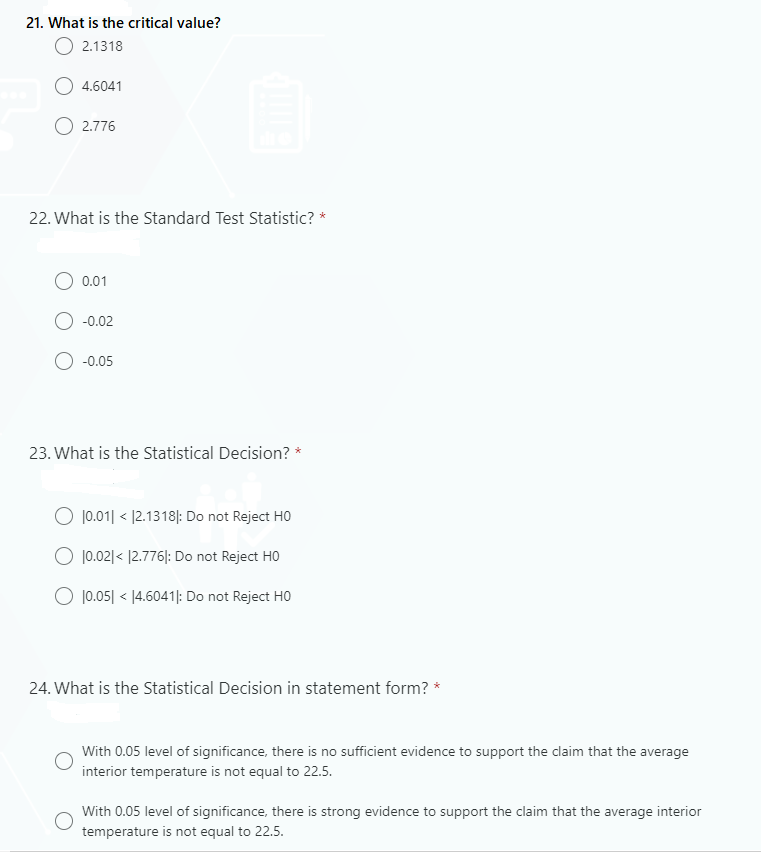
Transcribed Image Text:21. What is the critical value?
2.1318
4.6041
O 2.776
22. What is the Standard Test Statistic? *
0.01
-0.02
-0.05
23. What is the Statistical Decision? *
|0.01| < 12.1318|: Do not Reject HO
|0.02| < |2.776|: Do not Reject HO
0.05| < |4.6041|: Do not Reject HO
24. What is the Statistical Decision in statement form? *
With 0.05 level of significance, there is no sufficient evidence to support the claim that the average
interior temperature is not equal to 22.5.
With 0.05 level of significance, there is strong evidence to support the claim that the average interior
temperature is not equal to 22.5.
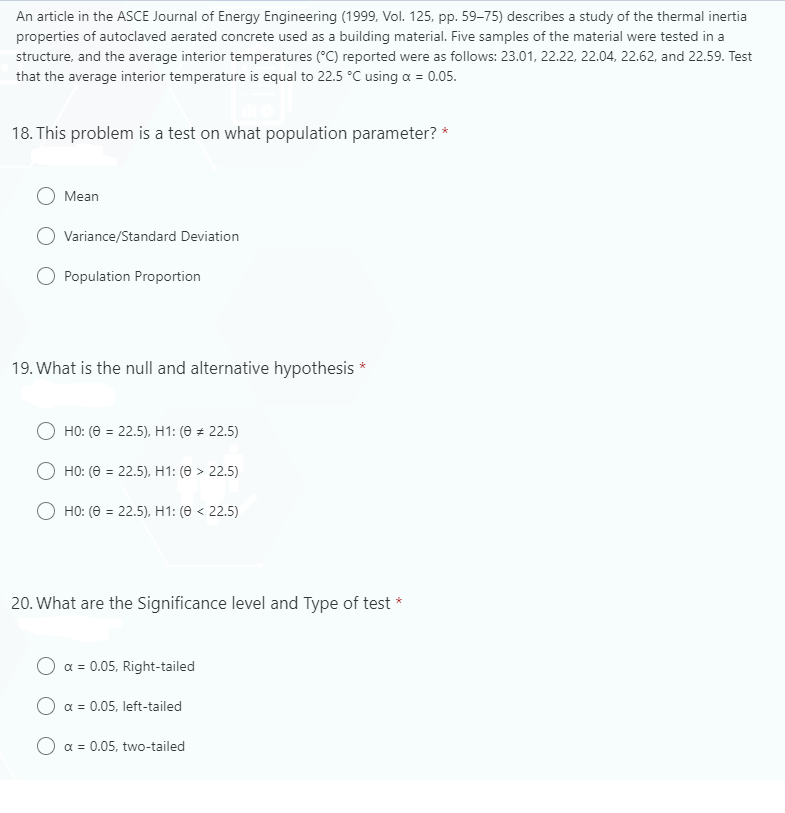
Transcribed Image Text:An article in the ASCE Journal of Energy Engineering (1999, Vol. 125, pp. 59–75) describes a study of the thermal inertia
properties of autoclaved aerated concrete used as a building material. Five samples of the material were tested in a
structure, and the average interior temperatures (°C) reported were as follows: 23.01, 22.22, 22.04, 22.62, and 22.59. Test
that the average interior temperature is equal to 22.5 °C using a = 0.05.
18. This problem is a test on what population parameter? *
Mean
Variance/Standard Deviation
Population Proportion
19. What is the null and alternative hypothesis *
HO: (0 = 22.5), H1: (0 = 22.5)
%3D
O HO: (0 = 22.5), H1: (0 > 22.5)
O HO: (0 = 22.5), H1: (0 < 22.5)
20. What are the Significance level and Type of test *
a = 0.05, Right-tailed
a = 0.05, left-tailed
a = 0.05, two-tailed
Expert Solution
This question has been solved!
Explore an expertly crafted, step-by-step solution for a thorough understanding of key concepts.

This is a popular solution!

Trending now
This is a popular solution!

Step by step
Solved in 2 steps with 2 images

Recommended textbooks for you
Glencoe Algebra 1, Student Edition, 9780079039897…
Algebra
ISBN:
9780079039897
Author:
Carter
Publisher:
McGraw Hill
Glencoe Algebra 1, Student Edition, 9780079039897…
Algebra
ISBN:
9780079039897
Author:
Carter
Publisher:
McGraw Hill