The table below shows a frequency distribution of the lifetimes of electronic tubes produced at a factory, determine the percentage of electronic tubes with lifetimes are at least 400 hours but less than 700 hours. A-19% B-29.5% C-78% D-51.5% E-45%
The table below shows a frequency distribution of the lifetimes of electronic tubes produced at a factory, determine the percentage of electronic tubes with lifetimes are at least 400 hours but less than 700 hours. A-19% B-29.5% C-78% D-51.5% E-45%

Materials Science And Engineering Properties
1st Edition
ISBN:9781111988609
Author:Charles Gilmore
Publisher:Charles Gilmore
Chapter15: Experimental Methods
Section: Chapter Questions
Problem 1CQ

Related questions
Question
Engineering statistics, i need solutions in 10 minutes please.
MCQ/The table below shows a frequency distribution of the lifetimes of electronic tubes produced at a factory, determine the percentage of electronic tubes with lifetimes are at least 400 hours but less than 700 hours.
A-19%
B-29.5%
C-78%
D-51.5%
E-45%
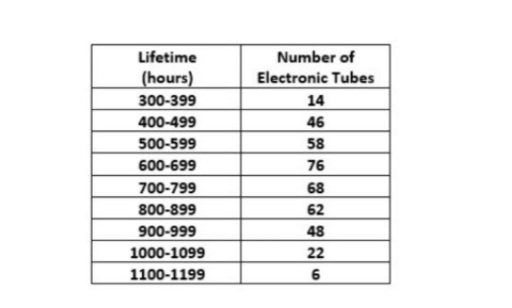
Transcribed Image Text:Lifetime
Number of
(hours)
Electronic Tubes
300-399
14
400-499
46
500-599
58
600-699
76
700-799
68
800-899
62
900-999
48
1000-1099
22
1100-1199
6.
Expert Solution
This question has been solved!
Explore an expertly crafted, step-by-step solution for a thorough understanding of key concepts.

Step by step
Solved in 2 steps

Knowledge Booster


Learn more about
Need a deep-dive on the concept behind this application? Look no further. Learn more about this topic, civil-engineering and related others by exploring similar questions and additional content below.Recommended textbooks for you
Materials Science And Engineering Properties
Civil Engineering
ISBN:
9781111988609
Author:
Charles Gilmore
Publisher:
Cengage Learning
Materials Science And Engineering Properties
Civil Engineering
ISBN:
9781111988609
Author:
Charles Gilmore
Publisher:
Cengage Learning