The table below shows some of the expenditure amounts in the economy of Arkinia. The MPC, the MTR, and the MPM are all constant, as are the values of the three injections. a. Complete the table below. Y e 2008 200 1085 400 500 600 700 HIND T GO 1141 100 Yp GB 460 620 C 130 195 325 455 S The Economy of Arkinia -3 10 40 100 I Se 50 50 50 50 50 150 50 50 G 180 180 180 180 180 180 180 180 180 X 50 0 50 50 50 50 50 54 54 50 IM 40 50 66 XN 10 -40 Draw a 45° line (labelled Y) and the aggregate expenditure function, labelled AE1. Identify expenditure equilibrium with the letter et. Use the tool "et" to show the expenditure equilibrium. Plot only the endpoints of Y and AE. Once all points have been plotted, click on the line (not individual points) and a tool icon will pop up. You can use this to enter exact co-ordinates for your points as needed. AF
The table below shows some of the expenditure amounts in the economy of Arkinia. The MPC, the MTR, and the MPM are all constant, as are the values of the three injections. a. Complete the table below. Y e 2008 200 1085 400 500 600 700 HIND T GO 1141 100 Yp GB 460 620 C 130 195 325 455 S The Economy of Arkinia -3 10 40 100 I Se 50 50 50 50 50 150 50 50 G 180 180 180 180 180 180 180 180 180 X 50 0 50 50 50 50 50 54 54 50 IM 40 50 66 XN 10 -40 Draw a 45° line (labelled Y) and the aggregate expenditure function, labelled AE1. Identify expenditure equilibrium with the letter et. Use the tool "et" to show the expenditure equilibrium. Plot only the endpoints of Y and AE. Once all points have been plotted, click on the line (not individual points) and a tool icon will pop up. You can use this to enter exact co-ordinates for your points as needed. AF

Macroeconomics: Principles and Policy (MindTap Course List)
13th Edition
ISBN:9781305280601
Author:William J. Baumol, Alan S. Blinder
Publisher:William J. Baumol, Alan S. Blinder
Chapter8: Aggregate Demand And The Powerful Consumer
Section: Chapter Questions
Problem 8DQ

Related questions
Question
Transcribed Image Text:EV
Text Predictions: On
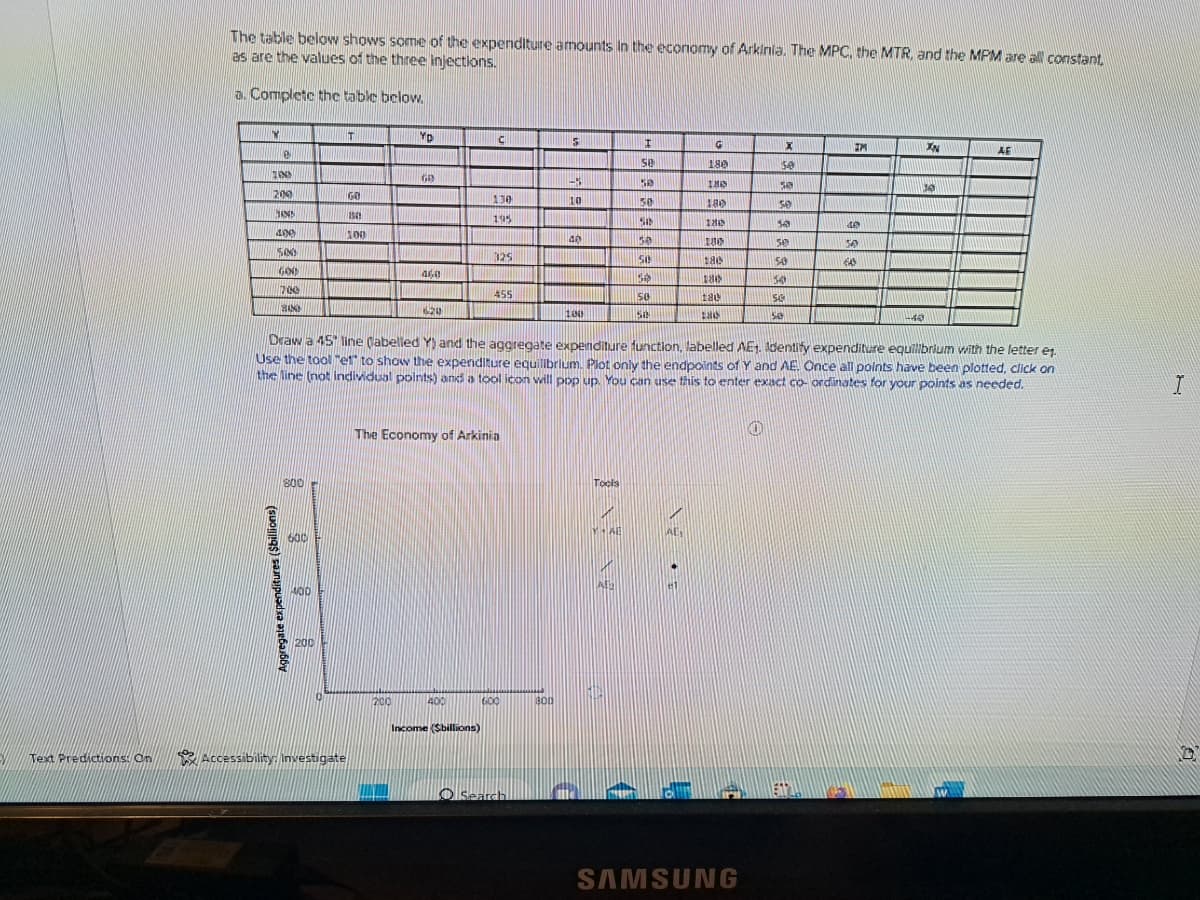
The table below shows some of the expenditure amounts in the economy of Arkinia. The MPC, the MTR, and the MPM are all constant,
as are the values of the three injections.
a. Complete the table below.
W
8
ZIN
200
SAN
400
500
GOO
Aggregate expenditures ($billions)
700
HANS
800
600
HOD
200
T
GO
1541
100
Accessibility: Investigate
YD
GB
200
460
620
C
400
130
195
Income (Sbillions)
325
The Economy of Arkinia
455
600
Search
5
800
-3
10
40
100
Tools
MAL
I
se
A
SB
50
Se
58
50
30
50
Sa
Draw a 45° line (labelled Y) and the aggregate expenditure function, labelled AE1. Identify expenditure equilibrium with the letter et.
Use the tool "et" to show the expenditure equilibrium. Plot only the endpoints of Y and AE. Once all points have been plotted, click on
the line (not individual points) and a tool icon will pop up. You can use this to enter exact co-ordinates for your points as needed.
G
180
AE₁
IMO
180
THIN
13
180
186
tac
taid
X
50
sa
SAMSUNG
50
10
50
50
54
549
50
IM
40
50
60
XN
10
-43
AF
I
Transcribed Image Text:ext Predictions: On
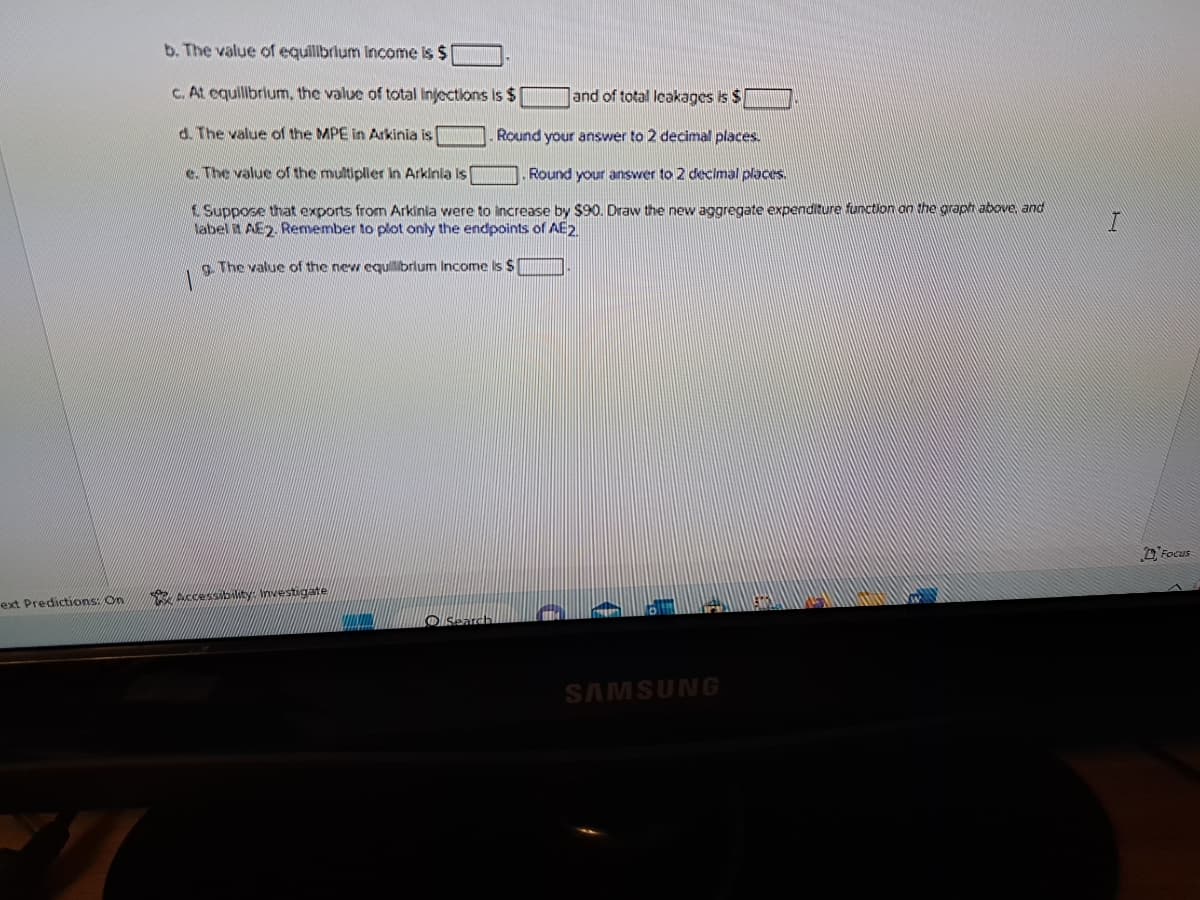
b. The value of equilibrium income is $
c. At equilibrium, the value of total Injections
d. The value of the MPE in Arkinia is
is $1
and of total leakages is $
Round your answer to 2 decimal places.
e. The value of the multiplier in Arkinia is
Round your answer to 2 decimal places.
Suppose that exports from Arkinia were to increase by $90. Draw the new aggregate expenditure function on the graph above, and
label it AE2. Remember to plot only the endpoints of AE2
g. The value of the new equilibrium Income is $
Accessibility: Investigate
Search
SAMSUNG
I
Focus
Expert Solution
This question has been solved!
Explore an expertly crafted, step-by-step solution for a thorough understanding of key concepts.

This is a popular solution!

Trending now
This is a popular solution!

Step by step
Solved in 2 steps with 1 images

Knowledge Booster


Learn more about
Need a deep-dive on the concept behind this application? Look no further. Learn more about this topic, economics and related others by exploring similar questions and additional content below.Recommended textbooks for you
Macroeconomics: Principles and Policy (MindTap Co…
Economics
ISBN:
9781305280601
Author:
William J. Baumol, Alan S. Blinder
Publisher:
Cengage Learning


Macroeconomics: Principles and Policy (MindTap Co…
Economics
ISBN:
9781305280601
Author:
William J. Baumol, Alan S. Blinder
Publisher:
Cengage Learning

Economics (MindTap Course List)
Economics
ISBN:
9781337617383
Author:
Roger A. Arnold
Publisher:
Cengage Learning
