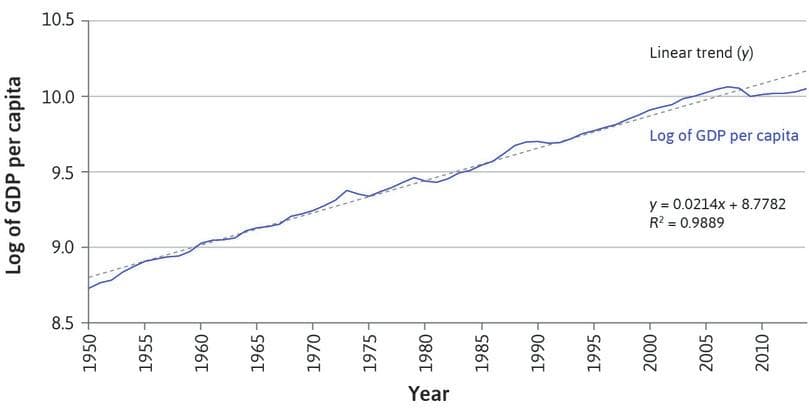
Select one or more: a. The trend growth rate over the period was around 2.14 % per annum. b. The graph shows that in 1950 UK GDP per capita was about £8.75. c. When actual output is below trend output the economy is in recession. d. The trend growth rate over the period was 0.9889% per annum.


Q: BYOB is a monopolist in beer production and distribution in the imaginary economy of Hopsville.…
A: As per economics, a cost curve is a graph of the costs of production as a function of the aggregate…
Q: The Big Brother Box (3B) produces packing boxes for the local vegetable farms. Currently, they are…
A: The term "Multi factor productivity" (MFP) refers to a method of evaluating economic performance…
Q: A firm produces output according to a production function: Q=F(K,L) = min (4K,8L). a. How much…
A: A production function exhibits the relationship between the inputs and the output. There are various…
Q: racey, the programs manager has hired you as a consultant to advice if she needs to ask the…
A: To calculate the Kelly's and Fisher's price index numbers for 2022, we need to first calculate the…
Q: What is the value for Gross Domestic Product if consumer spending is $25,486, gross private domestic…
A: Gross Domestic Product (GDP) refers to the measure of a country's total economic output in a given…
Q: Question 20 Hide Correct Answer Show Responses Suppose there is a negative output gap of 12 (the…
A: potential output level means that economy is producing at full capacity and beyond that production…
Q: The value of equilibrium incomo
A: The value of equilibrium income can be found by setting aggregate demand (C + I + XN) equal to…
Q: Supply & Demand In supply (and demand) problems, y is the number of items the supplier will produce…
A: A fundamental idea in economics, supply and demand describes the connection between the quantity of…
Q: Can you graph this? So i can visualize! Thank you
A: It is written that both the supply and demand curve shifts leftward and we will show that below.
Q: viting this editorial? Alexi and Tony own a food truck that serves only two items, street tacos and…
A: Output per hour Street Taco Cuban Sandwiches Alexi 80 20 Tony 100 30
Q: PISTACHIOS (Millions of pounds) 16 14 12 10 0 0 PPF 2 6 Glacier 4 PEAS (Millions of pounds) 8 10 12…
A: Opportunity cost is the cost of producing one good in terms of other. Opportunity cost shows the…
Q: 3. An econometrician regressed the cake sales on the cake price as well as the expenditure on…
A: 4. The correct statement is: B. The estimated marginal revenue is 12.151 +2(−2.768)ADVERT. The…
Q: True/False Road is a type of public good
A: Public goods are goods that are both non-excludable and non-rivalrous.
Q: Suppose that the govern- ment imposes a producer tax. That is, the firm pays t units of consumption…
A:
Q: Statement and Balance Sheet. (Remember that Retained Earnings, which was omitted from the Balance…
A: Corrected Tersun Income Statement, Month ended 31 December 2021: Sales revenue 42,000 Share capital…
Q: If you offer to buy a car for $11.000 but you had meant to offer $10,000 (the list price was…
A: Pricing basically refers to the process of determining the value of a product or service and setting…
Q: Which of the following is not an advantage of trade liberalization? Select one: a. An access to a…
A: Trade Liberalization Trade liberalization is the practice of decreasing or eliminating obstacles…
Q: (Figure: Determining Production Possibilities 3) According to the graph, the output combination…
A: The Production Possibilities Frontier (PPF) is a diagram or a figure that represents all possible…
Q: Suppose ABC is still a monopolist selling to the two retailers but it now discovers that if…
A: A monopolist is a firm or entity that has complete control over the supply of a good or service in a…
Q: 2. Draw an isoprofit map and demand curve for a firm that is making a loss. 3. Calculate and sketch…
A: The demand made by a consumer and the factors of production that are used in the production process…
Q: Referring to the table below, fill in the missing data for the country of Birchwood. Consumption…
A:
Q: The marginal revenue function for Johnson Widget Works (JWW) is given by dr 100q+43 dq q² +4q+3 =…
A: Given functions drdq=100q+43q2+4q+3dcdq=3q is in 100 unitsRevenue is measured in $1000 Cost is…
Q: 1. Micky's auto mechanic shop has a daily total cost represented by: C = 98 + 2q + 2q². Shop's…
A: The AC is the average price of goods and services. At the point when we have numerous items to sell…
Q: Assume that a steel company sold $152 million worth of steel, paid $64 million in wages, purchased…
A: National income is the total income obtained from all goods and services produced within a boundary…
Q: Suppose the real GDP of an economy is $520 billion dollars and its unemployment rate is 8%. If the…
A: In an economy the output gap refers to the percentage deviation of real GDP of a country to its…
Q: 7.7. HDTV STANDARDS. Consider the following game depicting the process of standard setting in…
A: The Nash Equilibrium is a concept in game theory that describes a state of balance between the…
Q: Let's say PPF in the diagram to the right is for the year 2022 — How can we shift out the frontier…
A: Introduction: The different combinations of two goods that can be produced with a specific set of…
Q: What are the implications of imbalances between injections and leakages?
A: In an economy, injections refer to the total amount of spending that enters the economy, while…
Q: Figure: Leonard's Demand for Pecan Pie) Look at Leonard's weekly demand curve for slices of pie. How…
A: Demand curve is the downward sloping curve. The Law of demand states that :- Higher the price ,…
Q: 6. What is the opportunity 7. What is the opportunity cost of a burrito? cost of a soda?
A:
Q: Why do governments typically issue general long-term debt? What types of services might be limited…
A: Government debt refers to the debt taken by the government from the citizens of the country to…
Q: QUESTION 35 35. What is the solution to the political problem associated with international trade?…
A: ***Since the student has posted multiple questions, hence, the expert is required to solve only the…
Q: a. The size of its recessionary gap is $ b. The size of this gap as a percentage of its actual GDP…
A: Okun's Law is an empirically observed relationship between unemployment and losses in a country's…
Q: The table below shows the data for the country of Magnolia. Complete the national income accounting…
A: We know that national income accounting is a government bookkeeping system that measures the…
Q: popular brand of decorative clay floor tile is priced at $7 per square until a surge in supply…
A: In the short term demand is likely to be more inelastic (low = less than 1). If people are utilized…
Q: Consider the daily market for hot dogs in a small city. Suppose that this market is in long-run…
A: A perfectly competitive firm is a price taker as there are many firms producing identical goods. It…
Q: Consider a closed economy without government; resource constraint is Y = C Production is (FIRST…
A: Economic equilibrium is a condition or state wherein economic forces are adjusted. Economic…
Q: It must be answered in a maximum of five sentences only. Is being trapped within the processes…
A: The process of greater interdependence and interconnection across nations, economies, and…
Q: A low exchange rate results in Select one: a. The imports of a country increasing b. Cheaper imports…
A: Exchange rate refers to the rate at which two countries make exchange of goods and services. The…
Q: When playing basketball, Thiago makes 30% of his free throws. In a recent game Thiago attempted 30…
A: Given information Thiago plays basketball. And he makes 30% of his free throws. It means the…
Q: How Many Hours at the Barber Shop? The opportunity cost of your time of cutting hair at your…
A: Marginal revenue is how much revenue one could acquire from selling one additional unit. Marginal…
Q: A commercial bank has capital of 5000 and a leverage ratio of 10. If the value of the banks assets…
A: Increment by 0.5% to keep up with the leverage ratio of 10. The capital increment required can be…
Q: The movie theater in Glendon has two types of customers: domestic students (group 1) and…
A: When a monopolist is discriminating prices between two or more markets, the equilibrium prices that…
Q: Hubert owns a plot of land in the desert that isn't worth much. One day, a giant meteorite falls on…
A: A market formation is characterized by one seller, selling a unique product in the market. In a…
Q: In the aftermath of a hurricane, an entrepreneur took a one-month leave of absence (without pay)…
A: The entrepreneur's total cost per gallon of water is $1.38 + $2.12 = $3.50. To turn a profit, the…
Q: construction. The contractor found two possible sources of gravel with the following data: Average…
A: Total cost implies the total expense incurred in reaching a specific level of output; if such total…
Q: In Zimbabwe the rate of inflation hit 90 sextillion percent in 2009, with prices increasing tenfold…
A: Hyperinflation refers to a scenario in which inflation is extremely higher and acceleration. In such…
Q: 4. Describe and comment on each of the following education development relationships: a. Education…
A: Economic growth refers to a measure of the increase in a country's real Gross Domestic Product (GDP)…
Q: The exchange rate is 1 £ = 3 $. Which action would be undertaken if a fixed regime is followed, and…
A: Exchange rate is the rate at which currency of one country can be expressed in terms of the other…
Q: q 0 1 2 3 4 5 6 7 8 9 10 tr 30 58 84 108 130 150 168 184 198 210 tc 10 23 30 41 56 75 98 125 156 191…
A: b) The assessment of the associated costs and potential rewards of specific firm operations or…

Step by step
Solved in 2 steps


- This case study focuses on the Australian economy in 2019, before the COVID-19 pandemic hit. On 4th September 2019, the Australian Bureau of Statistics (ABS) published Real GDP data for the quarter ending June, 2019. (The reporting of GDP always lags by about 2 months as it takes time to collect and compile data). The data showed that the Australian economy recorded a quarterly growth of 0.5%. However, there was a decrease in Real GDP per capita. Furthermore, Real GDP per capita in June 2019 was lower than it was a year before (June 2018). Overall, while Real GDP still increased, the growth was very weak; the weakest on record since March 2001. (Source: Australian Financial Review and The Guardian). Question 4. Given the economic conditions described above, recommend the appropriate monetary policy that the Reserve Bank of Australia (RBA) should implement.Clearly explain why this type of monetary policy is needed. Question 5. Describe in details the steps the RBA must undertake to…This case study focuses on the Australian economy in 2019, before the COVID-19 pandemic hit. On 4th September 2019, the Australian Bureau of Statistics (ABS) published Real GDP data for the quarter ending June, 2019. (The reporting of GDP always lags by about 2 months as it takes time to collect and compile data). The data showed that the Australian economy recorded a quarterly growth of 0.5%. However, there was a decrease in Real GDP per capita. Furthermore, Real GDP per capita in June 2019 was lower than it was a year before (June 2018). Overall, while Real GDP still increased, the growth was very weak; the weakest on record since March 2001. (Source: Australian Financial Review and The Guardian). Required: Question 1. Clearly explain what Real GDP per capita means.Clearly explain why Real GDP per capita decreased whereas there was still growth in Real GDP for the quarter ending June 2019. Question 2. Given the economic conditions described above, predict how the following key…This case study focuses on the Australian economy in 2019, before the COVID-19 pandemic hit. On 4th September 2019, the Australian Bureau of Statistics (ABS) published Real GDP data for the quarter ending June 2019. (The reporting of GDP always lags by about 2 months as it takes time to collect and compile data). The data showed that the Australian economy recorded quarterly growth of 0.5%. However, there was a decrease in Real GDP per capita. Furthermore, Real GDP per capita in June 2019 was lower than it was a year before (June 2018). Overall, while Real GDP still increased, the growth was very weak; the weakest on record since March 2001. (Source: Australian Financial Review and The Guardian). Questions: Question 4. Given the economic conditions described above, recommend the appropriate monetary policy that the Reserve Bank of Australia (RBA) should implement.Clearly explain why this type of monetary policy is needed. Question 5. Describe in detail the steps the RBA must…
- This case study focuses on the Australian economy in 2019, before the COVID-19 pandemic hit. On 4th September 2019, the Australian Bureau of Statistics (ABS) published Real GDP data for the quarter ending June 2019. (The reporting of GDP always lags by about 2 months as it takes time to collect and compile data). The data showed that the Australian economy recorded quarterly growth of 0.5%. However, there was a decrease in Real GDP per capita. Furthermore, Real GDP per capita in June 2019 was lower than it was a year before (June 2018). Overall, while Real GDP still increased, the growth was very weak; the weakest on record since March 2001. (Source: Australian Financial Review and The Guardian). Question: Draw appropriate graph(s) to illustrate the Australian economy in June 2019, considering the previously described economic conditions.This case study focuses on the Australian economy in 2019, before the COVID-19 pandemic hit. On 4th September 2019, the Australian Bureau of Statistics (ABS) published Real GDP data for the quarter ending June 2019. (The reporting of GDP always lags by about 2 months as it takes time to collect and compile data). The data showed that the Australian economy recorded quarterly growth of 0.5%. However, there was a decrease in Real GDP per capita. Furthermore, Real GDP per capita in June 2019 was lower than it was a year before (June 2018). Overall, while Real GDP still increased, the growth was very weak; the weakest on record since March 2001. (Source: Australian Financial Review and The Guardian). Required: Question 1. Clearly explain what Real GDP per capita means.Clearly explain why Real GDP per capita decreased whereas there was still growth in Real GDP for the quarter ending June 2019. Question 2. Given the economic conditions described above, predict how the following key…County A & Country B both recorded an increase in real GDP of 5% per year from 1970 to 2005. During this time, the population of country A grew at 7% per year & the population for Country B grew at 3%. Which of the following is true during this period? a. Per capita GDP was the same for both Country A & Country B b. Per capita GDP decreased for Country B only c. Per capita GDP decreased for both Country A & Country B d. Per capital GDP decreased for Country A only
- In 1960 GDP per capita in the Republic of Korea (constant 2015 US$) was $1027. In 2021 it was $32731. Calculate the growth rate of real GDP per capita in the Republic of Korea over this period. Now suppose that the Republic of Korea grows at the same rate for the 70 years following 2021. What will the Republic of Korea real GDP per capitae in the year 2091? Note:- Do not provide handwritten solution. Maintain accuracy and quality in your answer. Take care of plagiarism. Answer completely. You will get up vote for sure.The following table shows real GDP per capita for Canada, South Korea, and Uganda between 1970 and 2000. All figures are in 1998 U.S. dollars. The (decade-long) economic growth rate for Canada is shown in the second column. For example, from 1970 to 1980, Canada's GDP grew from $12,717 to $16,731, an increase of $16,731−$12,717$12,717=32%$16,731−$12,717$12,717=32%. Use this method to fill in the growth rates for South Korea and Uganda. Canada South Korea Uganda Year Real GDP per Capita Growth Rate Real GDP per Capita Growth Rate Real GDP per Capita Growth Rate 1970 $12,717 $1,886 $190 1980 $16,731 32% $3,262 $182 1990 $19,540 17% $6,615 $176 2000 $23,156 19% $10,807 $247 Source: Organisation for Economic Cooperation and Development (OECD) 1.Compare the data for Canada and South Korea between 1970 and 1980. During this period, (south korea or canda?) had a higher level of real GDP per capita, while ( South Korea or…The table shows real GDP per capita (RGDPPC) for the fictitious country of Amerucana for a three-year span of time. 2011 2012 2013 Real GDP per capita $14,500 $15,500 $16,590 Enter your answers as percentages rounded to one decimal place. What is the growth rate of real GDP per capita from 2011 to 2012, and also 2012 to 2013?
- How large will Canada’s GDP be in 25 years? The answer depends on what the rate of growth in GDP will be over that 25-year period. A mathematical formula we can use for this calculation is the following: GDP2041 = GDP2016 (1 + g)25 where GDP2041 is the level of GDP in the year 2041, GDP2016 is the level of GDP in the year 2016, and g is the rate of growth in GDP. Assume that GDP in 2016 is $1000 million and assume that the value of g is 0.035 (3.5 percent per year). What will be the value of GDP in 2041? Now suppose that the value of g is 0.040 (4.0 percent per year). What will be the value of GDP in 2041 given this slightly larger rate of growth? What does this result say about the importance of policies that promote even slightly faster rates of growth in GDP?Imagine the GDP per capita of a country doubles every one hundred years. What would the shape of a linear-scale graph and a ratio-scale graph be? Select one or more: a. Linear scale: an upward-sloping curve with increasing slope (called convex shape) Ratio scale: an upward-sloping straight line b. Linear scale: an upward-sloping straight line Ratio scale: a straight horizontal line c. Linear scale: an upward-sloping straight line Ratio scale: an upward-sloping curve with decreasing slope (called concave shape) d. Linear scale: an upward-sloping convex curve Ratio scale: an upward-sloping convex curveAll values are 2005 dollars. Part a) Calculate the growth of GDP/capita in each column. Part b) Calculate the average annual growth in GDP/capita for japan, uk, and USA from 1980 to 2010 using the growth formula in the image. In the growth function, t is the current time period, t-j is the original time period, and g is the annual growth rate. Part c) In parts a and b, are the calculated values for nominal gdp/capita or real gdp/capita. Explain why.


