The table below shows the production of tobacco in the US, in millions of pounds. Tobacco production, in millions of pounds Year 2003 2004 2005 2006 2007 2008 2009 Production 803 882 645 728 788 801 823 Year 2010 2011 2012 2013 2014 2015 Production 718 598 763 724 876 711 (a) What is the average rate of change in tobacco production between 2004 and 2015? Give units and interpret your answer in terms of tobacco production. Round your answer to two decimal places. at a rate of approximately In the years between 2004 and 2015, the production of tobacco decreased V i million pounds per year (b) During this twelve-year period, are there any one-year intervals during which the average rate of change was positive? If so, when? 12004 2001 and 200s 2009 and 2010 2010 and 2011 2012 and 2013 2014 and 201S
The table below shows the production of tobacco in the US, in millions of pounds. Tobacco production, in millions of pounds Year 2003 2004 2005 2006 2007 2008 2009 Production 803 882 645 728 788 801 823 Year 2010 2011 2012 2013 2014 2015 Production 718 598 763 724 876 711 (a) What is the average rate of change in tobacco production between 2004 and 2015? Give units and interpret your answer in terms of tobacco production. Round your answer to two decimal places. at a rate of approximately In the years between 2004 and 2015, the production of tobacco decreased V i million pounds per year (b) During this twelve-year period, are there any one-year intervals during which the average rate of change was positive? If so, when? 12004 2001 and 200s 2009 and 2010 2010 and 2011 2012 and 2013 2014 and 201S

Managerial Economics: Applications, Strategies and Tactics (MindTap Course List)
14th Edition
ISBN:9781305506381
Author:James R. McGuigan, R. Charles Moyer, Frederick H.deB. Harris
Publisher:James R. McGuigan, R. Charles Moyer, Frederick H.deB. Harris
Chapter5: Business And Economic Forecasting
Section: Chapter Questions
Problem 1.2CE: Plot the logarithm of arrivals for each transportation mode against time, all on the same graph....

Related questions

Question
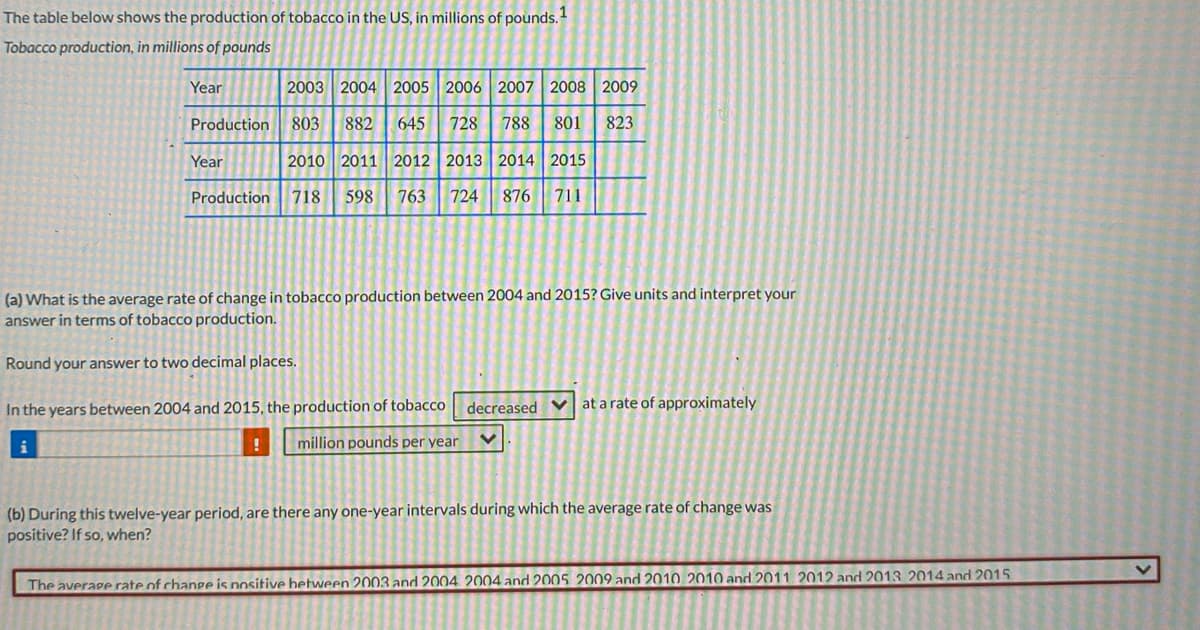
Transcribed Image Text:The table below shows the production of tobacco in the US, in millions of pounds.
Tobacco production, in millions of pounds
Year
2003 2004 2005 2006 2007 2008 2009
Production
803
882
645
728
788
801
823
Year
2010
2013
2014 2015
Production
718
598
763
724
876
(a) What is the average rate of change in tobacco production between 2004 and 2015? Give units and interpret your
answer in terms of tobacco production.
Round your answer to two decimal places.
In the years between 2004 and 2015, the production of tobacco
decreased V at a rate of approximately
i
million pounds per year
(b) During this twelve-year period, are there any one-year intervals during which the average rate of change was
positive? If so, when?
The average rate of change is nositive between 2003 and 2004 2004 and 2005. 2009 and 2010. 2010 and 2011. 2012 and 2013. 2014 and 2015.
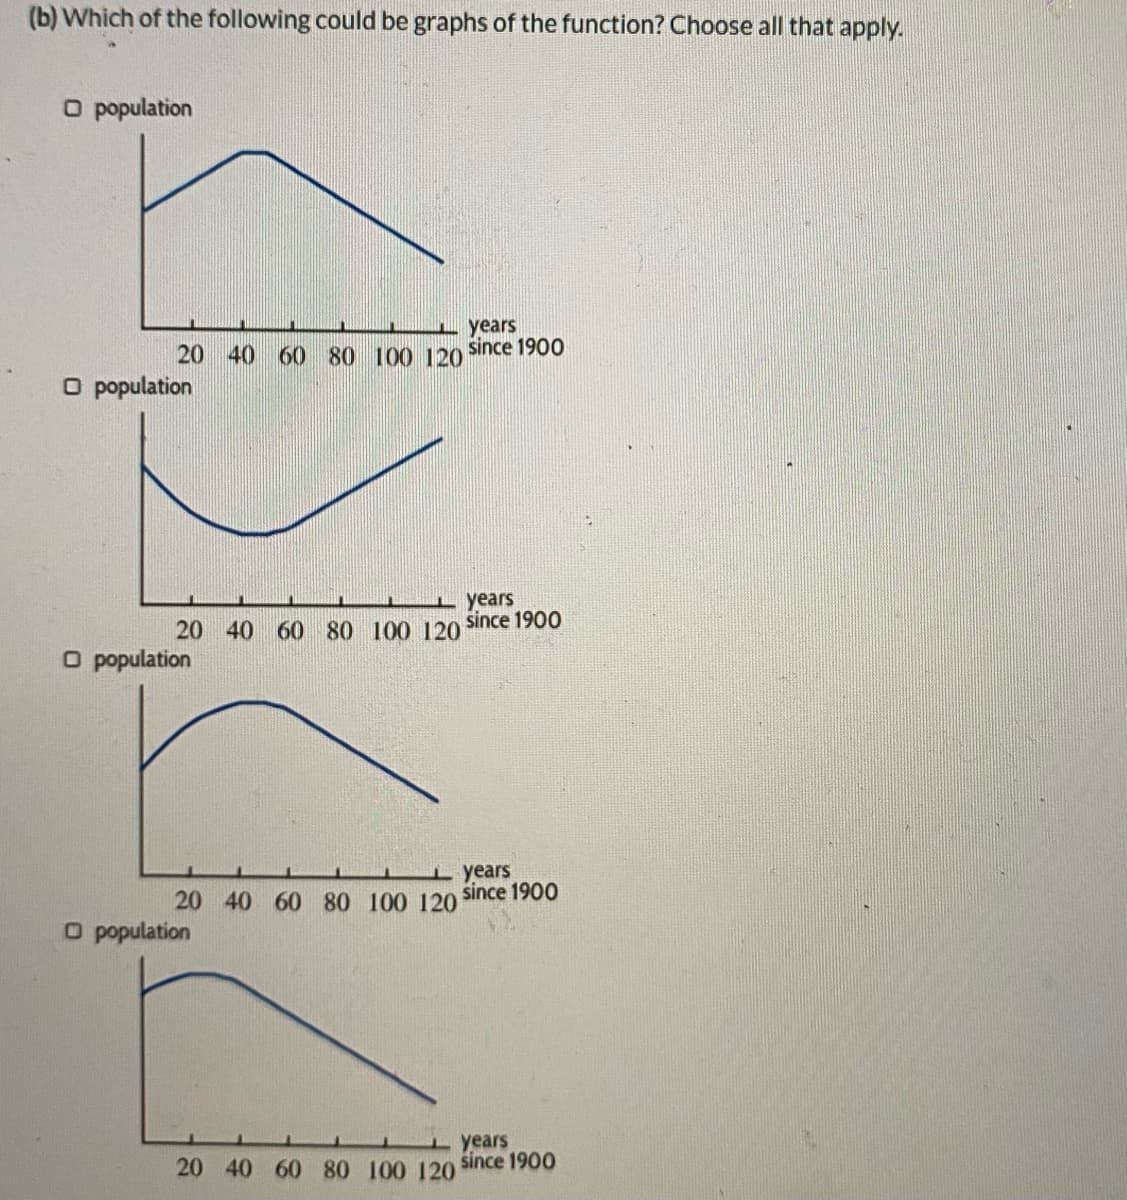
Transcribed Image Text:(b) Which of the following could be graphs of the function? Choose all that apply.
O population
years
20 40 60 80 100 120
since 1900
O population
I years
since 1900
20 40 60 80 100 120
O population
i years
20 40 60 80 100 120
since 1900
O population
years
20 40 60 80 100 120 since 1900
Expert Solution
This question has been solved!
Explore an expertly crafted, step-by-step solution for a thorough understanding of key concepts.

This is a popular solution!

Trending now
This is a popular solution!

Step by step
Solved in 2 steps

Knowledge Booster


Learn more about
Need a deep-dive on the concept behind this application? Look no further. Learn more about this topic, economics and related others by exploring similar questions and additional content below.Recommended textbooks for you
Managerial Economics: Applications, Strategies an…
Economics
ISBN:
9781305506381
Author:
James R. McGuigan, R. Charles Moyer, Frederick H.deB. Harris
Publisher:
Cengage Learning
Managerial Economics: Applications, Strategies an…
Economics
ISBN:
9781305506381
Author:
James R. McGuigan, R. Charles Moyer, Frederick H.deB. Harris
Publisher:
Cengage Learning