What is Hypothesis Testing?
In statistics, there are two ways to calculate the sample data. One is descriptive statistics and the other is inferential statistics. In descriptive statistics, all of the information is defined through graphs and charts. In inferential statistics, it allows one to test the hypothesis and it is always used to predict the data. Inferential statistics has two main areas: estimating parameters and hypothesis testing. A hypothesis is a statement about the unknown parameter of the population which we want to verify from the information available from the sample. The premise may or may not be true. The estimation of the whole population would be a reasonable way of deciding if the statistical hypothesis is valid. There are two types of hypotheses. They are null hypothesis and alternative hypothesis.
Null Hypothesis
- A null hypothesis is a statistical hypothesis under the assumption that it is valid.It is checked for possible rejection.
- The null hypothesis is the hypothesis of no difference.
- The notation of the null hypothesis is H0.
Alternative Hypothesis
- Any statistical hypothesis that is alternate to the null hypothesis.
- The notation of an alternative hypothesis is H1 or Ha.
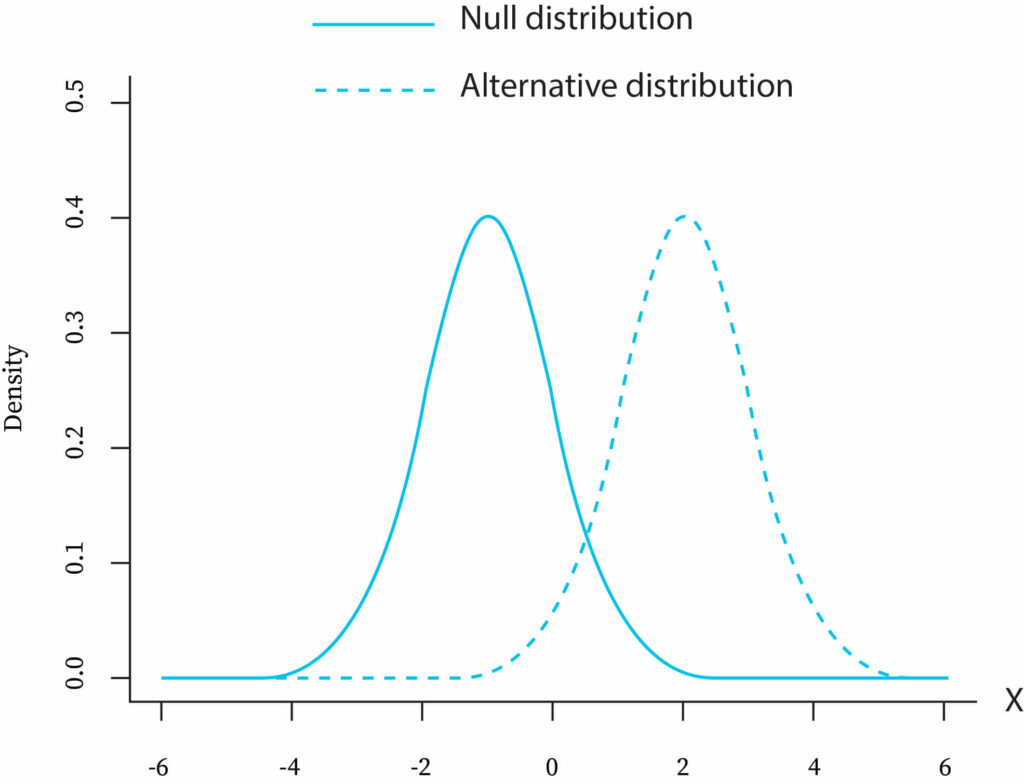
For example: on tossing a coin, two outcomes are available, that is head and tail. Let’s say we were to calculate whether a coin was fair and balanced. Now frame the Null hypothesis and Alternative hypothesis.
Null hypothesis: The number of heads and number of tails is the same.
Alternative hypothesis: The number of heads and number of tails is very different.
Symbolically the hypothesis is expressed as,
H0:µ=0.5
H1:µ≠0.5
Suppose we tossed the coin 100 times, and the result is head=75 and tail=25. Hence, it is clear that we reject the null hypothesis. Thus, we conclude based on proof that it was probably not a fair and balanced coin.
Sample and P-value
Sample Size
A sample is the finite set of objects which is taken from the whole population. The main aim of the sample is to represent the population. The number of observations in the samples called the size of the sample.
Sample Space
A collection of all possible outcomes of the random experiments is called sample space, which is denoted by S. For example: when tossing a coin there are two outcomes are available, they are head and tail. So, the sample space is head and tail.
That is S= {H, T}
Where S= sample space
H= Head
T=Tail
P-value
P-value is the probability value. The P-value lies between 0 to 1. When we test the distribution (T-test, Z test, chi-square test), the null hypothesis is rejected or accepted based on the P-value. The lower P-value is the stronger is the proof of the null hypothesis being denied.
Types of Errors
There are two types of errors that occur when we test a statistical hypothesis. They are type I error and type II error.
- Type I Error
The type I error occurs when the “null hypothesis is rejected when it is true”. The probability of committing a type I error is called the significance level. The probability is denoted by α, alpha. For example, rejecting the product when the quality of the product is good.
- Type II Error:
The type II error occurs when the “null hypothesis is accepted when it is false”. The probability of committing type II error is called beta and it is denoted by β. For example, giving full marks when the answer is wrong.
Regions of Sample Space
There are two regions in the sample space. They are critical region or rejection region and acceptance region.
- Critical Region
Here rejects the null hypothesis when the test statistic falls within the rejection region, that is, a set of values that falls beyond the region of acceptance. In this case, the null hypothesis has been rejected at the significance level (alpha).
- Acceptance Region
This is a range of values where the null hypothesis is not rejected when the test statistic falls within the acceptance region. It is defined that the chance of making a Type I error is equal to the level of significance.
Tailed Test
There are two types of tailed tests in statistical hypotheses. They are one-tailed test and two-tailed test.
One-Tailed test
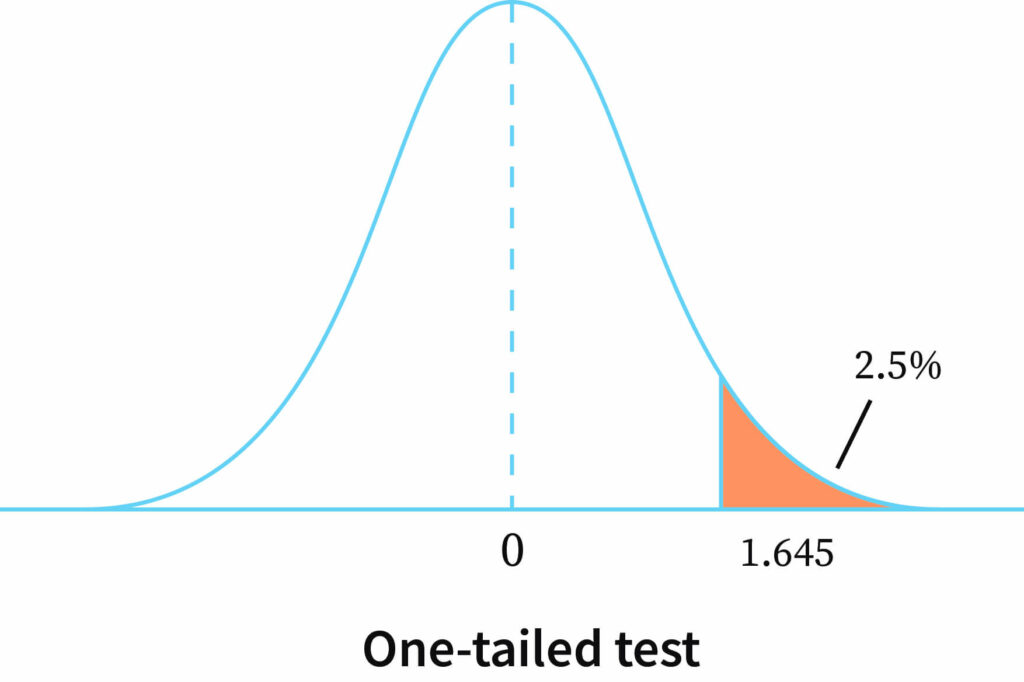
In this one-tailed test, the critical region lies entirely on one single side of the probability curve of test statistics. The null hypothesis is H0:μ=0. H1:μ>0 and H1:μ<0 are known as one-tailed alternatives. In a one-tailed test, two cases are available. They are the right-tailed tests and left-tailed tests. In the right-tailed test, the critical region lies entirely on the right side of the probability curve of test statistics. The right-tailed alternative test is H1:μ-0>0. The graph above clearly shows that the values fall on one single side and also that it falls on the right side. So, this is the right-tailed test. In the left-tailed test, the critical region lies entirely on the left side of the probability curve of test statistics. The left-tailed alternative test is H1:μ-0<0.
Two-tailed test
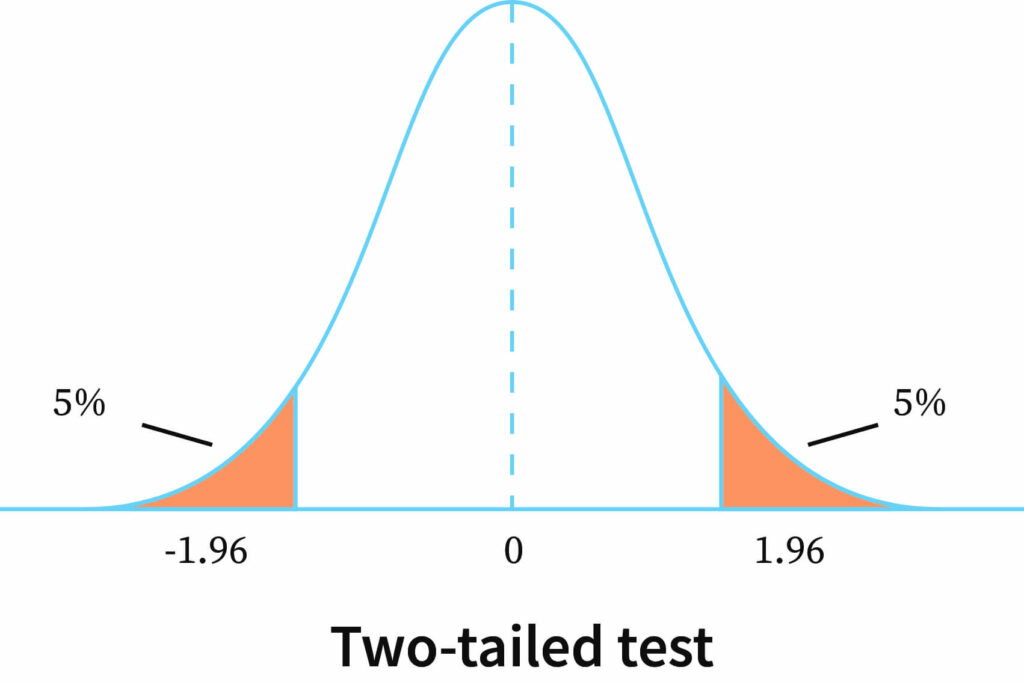
The critical region is given by the portion of the area lying in both tails of the probability curve of the test statistic. In a two-tailed test, the hypotheses are,
Null hypothesis H0:μ=0
Alternative hypothesis H1:μ≠0
The graph above clearly shows that the values fall on both sides. So, this is the two-tailed test.
Testing the Hypothesis
We have to test all the hypotheses in the same way. The testing of the hypothesis is explained below step by step.
- State the hypothesis
The analyst is required to state the null hypothesis and alternative hypothesis in every hypothesis test. While testing the distribution, always frame the null hypothesis and alternative hypothesis. The hypotheses stated should be mutually exclusive. That is, one is true in the hypothesis, and others could be false and vice versa.
- Analysis
This describes how to use sample data to accept or reject the null hypothesis. It should specify the following element.
- Significance level
This can be equal to 0.01, 0.05, or 0.10 as any value between 0 and 1 can be used.
- Test method
Computed from sample data, the test statistic might be a mean score, proportion, difference between means, the difference between proportions, z-score, t statistic, chi-squared, etc. If the test statistic value is less than the level of significance, then the null hypothesis is rejected.
- Test statistic
Here we calculate the test statistic. In test statistics, the sample mean, the population mean, standard deviation, and sample size are used.
- P-value
P-value is calculated by using degrees of freedom and the significance level. By using the statistical tables, P-value is calculated. The P-value is always between 0 and 1. Use the P-value to take a decision whether the hypothesis is statistically accepted or rejected.
- Interpretation
The inference is based on the relation of the P-value to the significance level and the rejection of the null hypothesis when the P-value is lower than the level of significance. Similarly, the hypothesis test was determined statistically.
Formula
The test statistics are calculated as:
Context and Applications
This topic is significant in the professional exams for both undergraduate and graduate courses, especially for
- Bachelor of Science in Statistics
- Master of Science in Statistics
Want more help with your economics homework?
*Response times may vary by subject and question complexity. Median response time is 34 minutes for paid subscribers and may be longer for promotional offers.
Hypothesis Testing Homework Questions from Fellow Students
Browse our recently answered Hypothesis Testing homework questions.