The table below shows the share of income going to each quintile of the income distribution for a nation in 1995 and 2015. Use this data to calculate what the points on a Lorenz curve would be, and sketch the Lorenz curve. The purple line represents 1995. The green line represents 2015. Share of Income Received 1995 2015 Bottom 20% 10% 5% Bottom 40% 20% 15% Bottom 60% 45% 35% Bottom 80% 75% 70% All 100% 100% 100% Provide your answer below: 110 100 * 90 80 490, 70) 70 (100, 70) 60 Perfect Equality (100,50 Year 2015 50 (80,50) Year 1995 -40 (70, 30) 30 (50, 20) 20 (90 20) 10 ( 60 10) 100 Income Quintiles 20 40 60 80 -10- | Cumulative Share of Income

Principles of Economics 2e
2nd Edition
ISBN:9781947172364
Author:Steven A. Greenlaw; David Shapiro
Publisher:Steven A. Greenlaw; David Shapiro
Chapter15: Poverty And Economic Inequality
Section: Chapter Questions
Problem 7SCQ: Table 15.9 shows the share of income going to each quintile of the income distribution for the...
icon
Related questions
Question
The table below shows the share of income going to each quintile of the income distribution for a nation in
1995 and 2015. Use this data to calculate what the points on a Lorenz curve would be, and sketch
the Lorenz curve.
The purple line represents 1995.
The green line represents 2015.
Share of Income Received
1995
2015
Bottom 20%
10%
5%
Bottom 40%
20%
15%
Bottom 60%
45%
35%
Bottom 80%
75%
70%
All 100%
100%
|100%
Provide your answer below:
110
100
-90
-80
A90, 70)
70
(100, 70)
-60
Perfect Equality
(100,50 Year 2015
50
(80,50) Year 1995
40
(70, 30)
30
(50, 20)
20
(90 20)
10
(60 10)
20
40
60
80
100
Income Quintiles
-10
Cumulative Share of Income
To o
Transcribed Image Text:The table below shows the share of income going to each quintile of the income distribution for a nation in 1995 and 2015. Use this data to calculate what the points on a Lorenz curve would be, and sketch the Lorenz curve. The purple line represents 1995. The green line represents 2015. Share of Income Received 1995 2015 Bottom 20% 10% 5% Bottom 40% 20% 15% Bottom 60% 45% 35% Bottom 80% 75% 70% All 100% 100% |100% Provide your answer below: 110 100 -90 -80 A90, 70) 70 (100, 70) -60 Perfect Equality (100,50 Year 2015 50 (80,50) Year 1995 40 (70, 30) 30 (50, 20) 20 (90 20) 10 (60 10) 20 40 60 80 100 Income Quintiles -10 Cumulative Share of Income To o
Expert Solution
Introduction

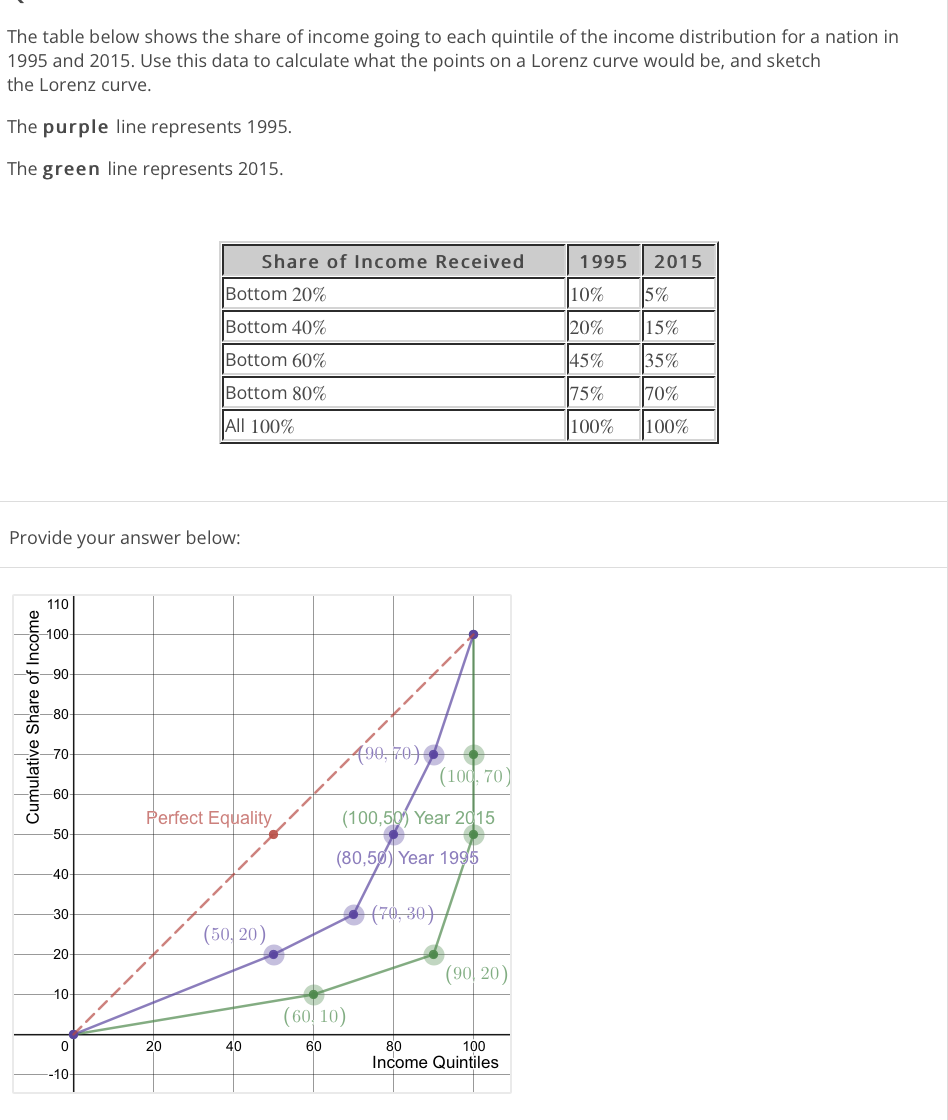
The graphical depiction of the income distribution is known as the Lorenz curve. The cumulative percent of income is plotted against the cumulative percent of the population in this graph. Income inequality will be large if the Lorenz curve is distant from the line of equality, and vice versa.

Gini coefficient ranges from the value 0 to 1. Perfect equality is represented by a 0 number, whereas perfect inequality is represented by a 1. The Lorenz curve demonstrates that the more the Lorenz curve deviates from the line of equality, the more unequal the situation.

trending now

Trending now

This is a popular solution!

steps

Step by step

Solved in 2 steps with 1 images

Blurred answer
Follow-up Questions
Read through expert solutions to related follow-up questions below.
Follow-up Question

The table below shows the share of income going to each quintile of the income distribution for a nation in 1955 and 2015. Use this data to calculate what the points on a Lorenz curve would be, and sketch the Lorenz curve. 

The purple line represents 1955.

The green line represents 2015.


Solution
Bartleby Expert
SEE SOLUTION
Knowledge Booster
Measurement of Inequality
Learn more about
Need a deep-dive on the concept behind this application? Look no further. Learn more about this topic, economics and related others by exploring similar questions and additional content below.
Recommended textbooks for you
Principles of Economics 2e
Economics
ISBN:
9781947172364
Author:
Steven A. Greenlaw; David Shapiro
Publisher:
OpenStax
Microeconomics
Microeconomics
Economics
ISBN:
9781337617406
Author:
Roger A. Arnold
Publisher:
Cengage Learning
Economics (MindTap Course List)
Economics
ISBN:
9781337617383
Author:
Roger A. Arnold
Publisher:
Cengage Learning
Exploring Economics
Exploring Economics
Economics
ISBN:
9781544336329
Author:
Robert L. Sexton
Publisher:
SAGE Publications, Inc
Micro Economics For Today
Economics
ISBN:
9781337613064
Author:
Tucker, Irvin B.
Publisher:
Cengage,
Economics For Today
Economics For Today
Economics
ISBN:
9781337613040
Author:
Tucker
Publisher:
Cengage Learning