The table below shows the weights and heights of the 15 students in Mr. Murray's statistics class. Weights and Heights of 15 Students in Mr. Murray's Statistics Class Height (inches) 64 | 60.5 | 76 | 66 | 67 71 73.5 75 Weight (pounds) 122 115 215 140| 138 163 167 | 225 195 199 76 77 69.5 70 70.5 63 169 185 192 | 135 180 73 Which scatterplot AND linear regression equation correctly express the student's weight in pounds, w, as a function of his or her height in inches, h? Helghts and Weights of 15 Statistics Students 78 76 74 72 w =0.1384h +46.6927. A 00 110 120 130 140 150 160 170 180 190 200 210 220 230 Height (inches) Helghts and Welghts of 15 Statistics Students 230 20 210 200 190 180 h= 5.9524w- 248.1255 170 В 160 190 140 130 120 110 100 62 64 68 70 72 74 76 78 80 Height (inches) Weight (pounds) Weight (pounds)
The table below shows the weights and heights of the 15 students in Mr. Murray's statistics class. Weights and Heights of 15 Students in Mr. Murray's Statistics Class Height (inches) 64 | 60.5 | 76 | 66 | 67 71 73.5 75 Weight (pounds) 122 115 215 140| 138 163 167 | 225 195 199 76 77 69.5 70 70.5 63 169 185 192 | 135 180 73 Which scatterplot AND linear regression equation correctly express the student's weight in pounds, w, as a function of his or her height in inches, h? Helghts and Weights of 15 Statistics Students 78 76 74 72 w =0.1384h +46.6927. A 00 110 120 130 140 150 160 170 180 190 200 210 220 230 Height (inches) Helghts and Welghts of 15 Statistics Students 230 20 210 200 190 180 h= 5.9524w- 248.1255 170 В 160 190 140 130 120 110 100 62 64 68 70 72 74 76 78 80 Height (inches) Weight (pounds) Weight (pounds)

Algebra & Trigonometry with Analytic Geometry
13th Edition
ISBN:9781133382119
Author:Swokowski
Publisher:Swokowski
Chapter10: Sequences, Series, And Probability
Section10.8: Probability
Problem 32E

Related questions
Question
Do not know it
Transcribed Image Text:11:56
LTE
Question 8
Q
Tools
ABG
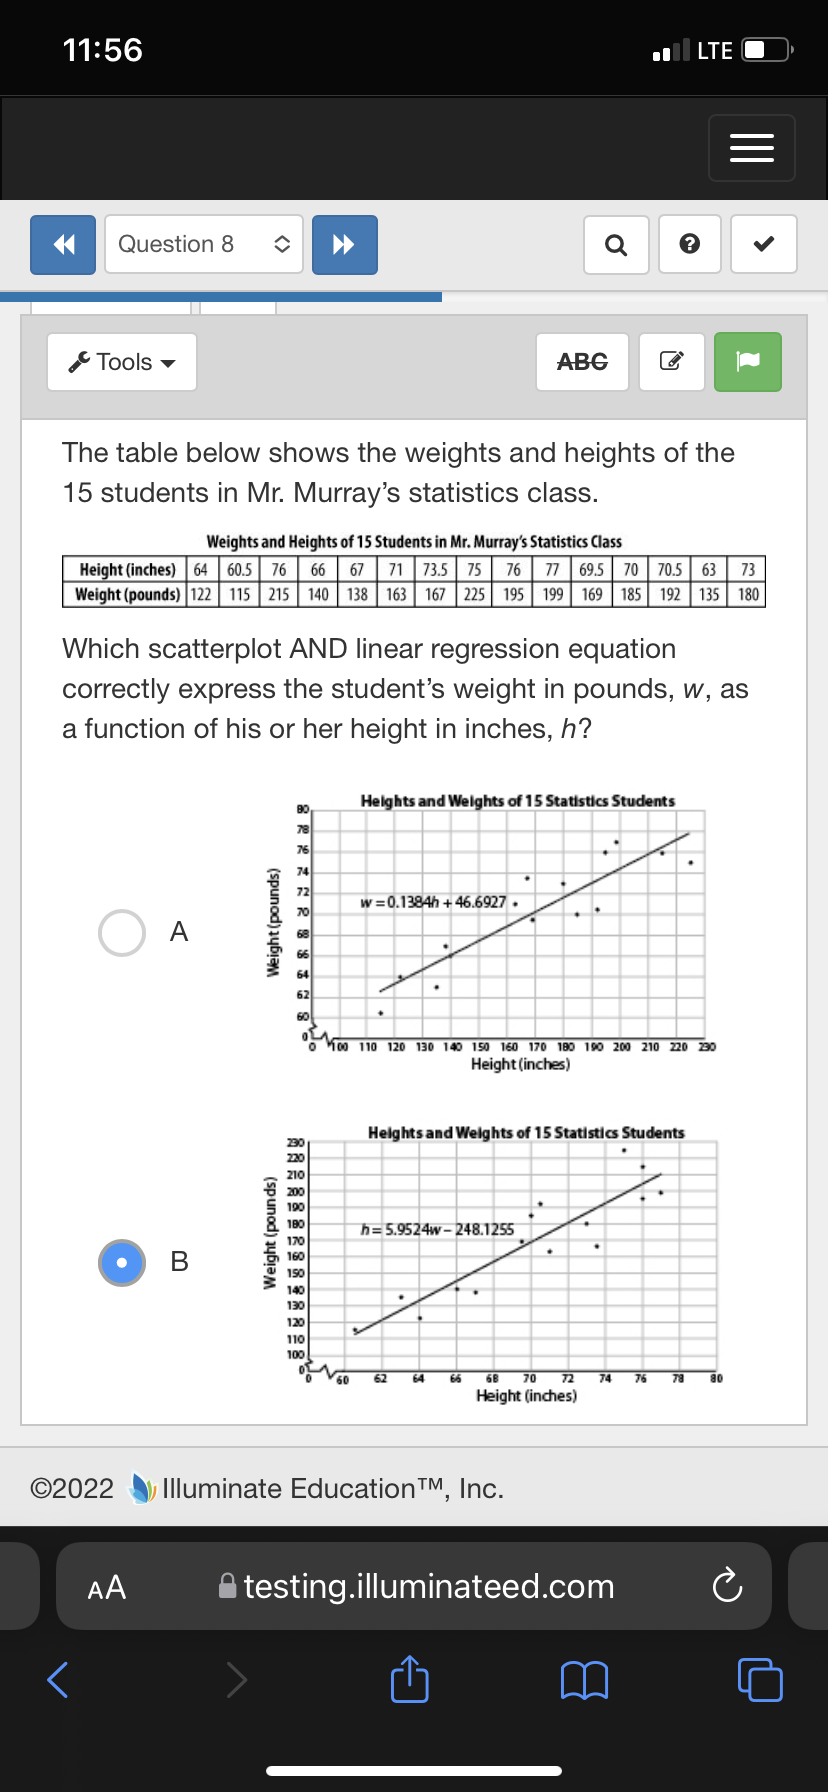
The table below shows the weights and heights of the
15 students in Mr. Murray's statistics class.
Weights and Heights of 15 Students in Mr. Murray's Statistics Class
73.5 75
Weight (pounds) 122 115 215 140 138 163 167 | 225 195 199| 169 | 185 192 135| 180
Height (inches) 64 60.5 76
66
67
71
76
77 69.5 70
70.5
63
73
Which scatterplot AND linear regression equation
correctly express the student's weight in pounds, w, as
a function of his or her height in inches, h?
Helghts and Welghts of 15 Statistics Students
80
78
76
74
72
w =0.1384h + 46.6927.
70
68
66
64
62
O M00 110 120 130 140 150 160 17O 180 190 200 210 220 30
Height (inches)
Helghts and Welghts of 15 Statistics Students
230
220
210
200
190
190
h= 5.9524w - 248.1255
170
В
160
150
140
130
120
110
100
70 72
Height (inches)
62
64
66
68
74
76
78
80
©2022
Illuminate EducationTM, Inc.
AA
testing.illuminateed.com
<>
(spunod)1ybiaM
(spunod) aybjam
Expert Solution
This question has been solved!
Explore an expertly crafted, step-by-step solution for a thorough understanding of key concepts.

This is a popular solution!

Trending now
This is a popular solution!

Step by step
Solved in 3 steps with 2 images

Recommended textbooks for you
Algebra & Trigonometry with Analytic Geometry
Algebra
ISBN:
9781133382119
Author:
Swokowski
Publisher:
Cengage
Algebra & Trigonometry with Analytic Geometry
Algebra
ISBN:
9781133382119
Author:
Swokowski
Publisher:
Cengage