The table below summarizes data from a survey of a sample of women. Using a 0.01 significance level, and assuming that the sample sizes of 700 men and 300 women are predetermined, test the claim that the proportions of agree/disagree responses are the same for subjects interviewed by men and the subjects interviewed by women. Does it appear that the gender of the interviewer affected the responses of women? - X Chi-square distribution table Gender of Interviewer Man 445 Woman Women who agree Women who disagree 263 255 37 Area to the Right of the Critical Value Click here to view the chi-square distribution table. Degrees of Freedom 0.995 0.99 0.975 0.95 0.90 0.10 Identify the null and alternative hypotheses. Choose the correct answer below. O A. Hg: The response of the subject and the gender of the subject are independent H: The response of the subject and the gender of the subject are dependent. 0.001 0.051 0.016 0211 0.584 1.064 1.610 2 204 2.706 4.605 6.251 0.004 2 0.010 0.020 0.103 3 0.072 0.115 0.216 0.352 0.207 0.412 0.676 0.297 0.554 0.872 4 0.484 0.711 7.779 OB. Hg: The proportions of agree/disagree responses are different for the subjects interviewed by men and the subjects interviewed by women. H: The proportions are the same. 1.145 1.635 5 0.831 1.237 1.690 2.180 2.700 9.236 10.645 7 0.989 1.239 2.167 2.833 12.017 OC. Hg: The proportions of agreeldisagree responses are the same for the subjects interviewed by men and the subjects interviewed by women. 2.733 3.325 3.940 13.362 14.684 15.987 1.344 1.646 3.490 H: The proportions are different. 9 1.735 2.156 2.088 2.558 4.168 4.865 10 3.247 Compute the test statistic. Round to three decimal places as needed.) Find the critical value(s) Print Done Round to three decimal places as needed. Use a comma to separate answers as needed) What is the conclusion based on the hypothesis test? V Họ. There sufficient evidence to warrant rejection of the claim that the proportions of agreeldisagree responses are the same for subjects interviewed by men and the subjects interviewed by women. It V that the gender of the interviewer affected the responses of women.
The table below summarizes data from a survey of a sample of women. Using a 0.01 significance level, and assuming that the sample sizes of 700 men and 300 women are predetermined, test the claim that the proportions of agree/disagree responses are the same for subjects interviewed by men and the subjects interviewed by women. Does it appear that the gender of the interviewer affected the responses of women? - X Chi-square distribution table Gender of Interviewer Man 445 Woman Women who agree Women who disagree 263 255 37 Area to the Right of the Critical Value Click here to view the chi-square distribution table. Degrees of Freedom 0.995 0.99 0.975 0.95 0.90 0.10 Identify the null and alternative hypotheses. Choose the correct answer below. O A. Hg: The response of the subject and the gender of the subject are independent H: The response of the subject and the gender of the subject are dependent. 0.001 0.051 0.016 0211 0.584 1.064 1.610 2 204 2.706 4.605 6.251 0.004 2 0.010 0.020 0.103 3 0.072 0.115 0.216 0.352 0.207 0.412 0.676 0.297 0.554 0.872 4 0.484 0.711 7.779 OB. Hg: The proportions of agree/disagree responses are different for the subjects interviewed by men and the subjects interviewed by women. H: The proportions are the same. 1.145 1.635 5 0.831 1.237 1.690 2.180 2.700 9.236 10.645 7 0.989 1.239 2.167 2.833 12.017 OC. Hg: The proportions of agreeldisagree responses are the same for the subjects interviewed by men and the subjects interviewed by women. 2.733 3.325 3.940 13.362 14.684 15.987 1.344 1.646 3.490 H: The proportions are different. 9 1.735 2.156 2.088 2.558 4.168 4.865 10 3.247 Compute the test statistic. Round to three decimal places as needed.) Find the critical value(s) Print Done Round to three decimal places as needed. Use a comma to separate answers as needed) What is the conclusion based on the hypothesis test? V Họ. There sufficient evidence to warrant rejection of the claim that the proportions of agreeldisagree responses are the same for subjects interviewed by men and the subjects interviewed by women. It V that the gender of the interviewer affected the responses of women.

Glencoe Algebra 1, Student Edition, 9780079039897, 0079039898, 2018
18th Edition
ISBN:9780079039897
Author:Carter
Publisher:Carter
Chapter10: Statistics
Section10.4: Distributions Of Data
Problem 19PFA

Related questions
Question
I cant figure out how to work out this question, can someone help me please? Thank you.
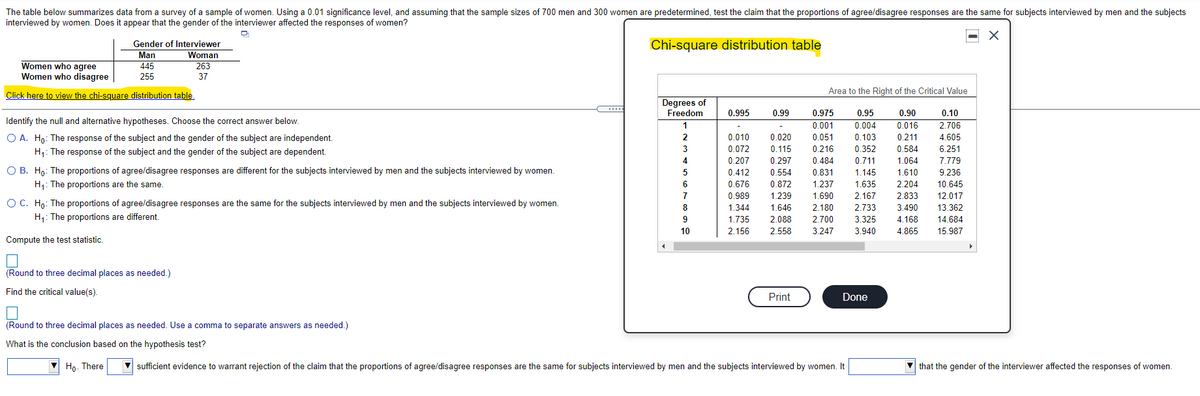
Transcribed Image Text:The table below summarizes data from a survey of a sample of women. Using a 0.01 significance level, and assuming that the sample sizes of 700 men and 300 women are predetermined, test the claim that the proportions of agree/disagree responses are the same for subjects interviewed by men and the subjects
interviewed by women. Does it appear that the gender of the interviewer affected the responses of women?
Gender of Interviewer
Woman
263
Chi-square distribution table
Man
Women who agree
Women who disagree
445
255
37
Area to the Right of the Critical Value
Click here to view the chi-square distribution table.
Degrees of
Freedom
.....
0.995
0.99
0.975
0.95
0.90
0.10
Identify the null and alternative hypotheses. Choose the correct answer below.
1
-
0.001
0.004
0.016
2.706
O A. Ho: The response of the subject and the gender of the subject are independent.
2
0.010
0.020
0.051
0.103
0.211
4.605
0.352
0.711
3
0.072
0.115
0.216
0.584
6.251
H1: The response of the subject and the gender of the subject are dependent.
4
0.207
0.297
0.484
1.064
7.779
O B. Ho: The proportions of agree/disagree responses are different for the subjects interviewed by men and the subjects interviewed by women.
5
0.412
0.554
0.831
1.145
1.610
9.236
H1: The proportions are the same.
6
0.676
0.872
1.237
1.635
2.204
10.645
7
0.989
1.239
1.690
2.167
2.833
12.017
OC. Ho: The proportions of agree/disagree responses are the same for the subjects interviewed by men and the subjects interviewed by women.
8
1.344
1.646
2.180
2.733
3.490
13.362
H1: The proportions are different.
9
1.735
2.088
2.700
3.325
4.168
14.684
10
2.156
2.558
3.247
3.940
4.865
15.987
Compute the test statistic.
(Round to three decimal places as needed.)
Find the critical value(s).
Print
Done
(Round to three decimal places as needed. Use a comma to separate answers as needed.)
What is the conclusion based on the hypothesis test?
Ho. There
sufficient evidence to warrant rejection of the claim that the proportions of agree/disagree responses are the same for subjects interviewed by men and the subjects interviewed by women. It
V that the gender of the interviewer affected the responses of women.
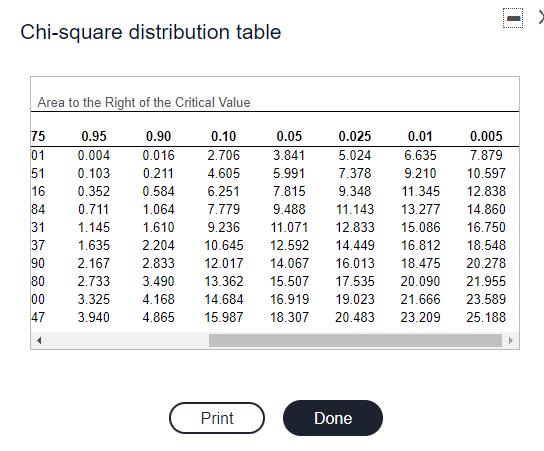
Transcribed Image Text:Chi-square distribution table
Area to the Right of the Critical Value
75
0.95
0.90
0.10
0.05
0.025
0.01
0.005
01
0.004
0.016
2.706
3.841
5.024
6.635
7.879
51
0.103
0.211
4.605
5.991
7.378
9.210
10.597
16
0.352
0.584
6.251
7.815
9.348
11.345
12.838
84
0.711
1.064
7.779
9.488
11.143
13.277
14.860
31
1.145
1.610
9.236
11.071
12.833
15.086
16.750
37
1.635
2.204
10.645
12.592
14.449
16.812
18.548
90
2.167
2.833
12.017
14.067
16.013
18.475
20.278
80
2.733
3.490
13.362
15.507
17.535
20.090
21.955
00
3.325
4.168
14.684
16.919
19.023
21.666
23.589
47
3.940
4.865
15.987
18.307
20.483
23.209
25.188
Print
Done
Expert Solution
This question has been solved!
Explore an expertly crafted, step-by-step solution for a thorough understanding of key concepts.

This is a popular solution!

Trending now
This is a popular solution!

Step by step
Solved in 3 steps with 7 images

Recommended textbooks for you
Glencoe Algebra 1, Student Edition, 9780079039897…
Algebra
ISBN:
9780079039897
Author:
Carter
Publisher:
McGraw Hill

College Algebra (MindTap Course List)
Algebra
ISBN:
9781305652231
Author:
R. David Gustafson, Jeff Hughes
Publisher:
Cengage Learning
Glencoe Algebra 1, Student Edition, 9780079039897…
Algebra
ISBN:
9780079039897
Author:
Carter
Publisher:
McGraw Hill
College Algebra (MindTap Course List)
Algebra
ISBN:
9781305652231
Author:
R. David Gustafson, Jeff Hughes
Publisher:
Cengage Learning