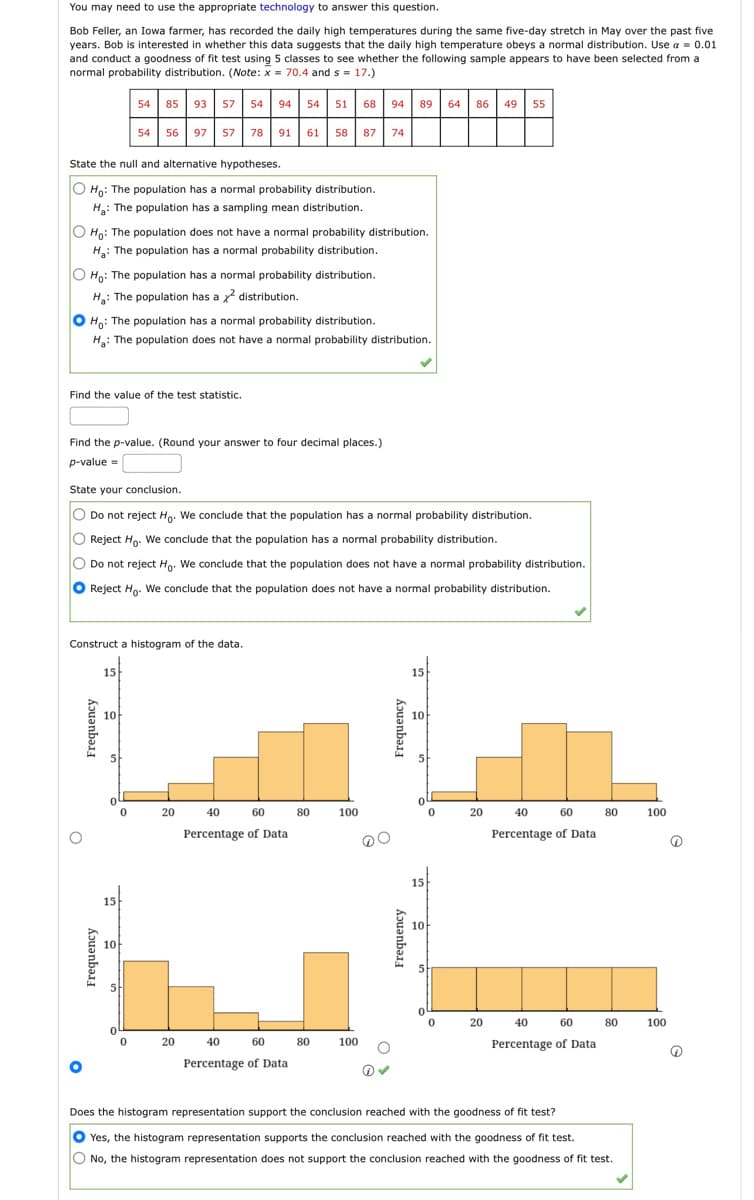
You may need to use the appropriate technology to answer this question. Bob Feller, an Iowa farmer, has recorded the daily high temperatures during the same five-day stretch in May over the past five years. Bob is interested in whether this data suggests that the daily high temperature obeys a normal distribution. Use a = 0.01 and conduct a goodness of fit test using 5 classes to see whether the following sample appears to have been selected from a normal probability distribution. (Note: x = 70.4 and s = 17.) 54 85 93 57 54 94 54 51 68 94 89 64 86 49 55 54 56 97 57 78 91 61 58 87 74 State the null and alternative hypotheses. Ho: The population has a normal probability distribution. Ha: The population has a sampling mean distribution. O Ho: The population does not have a normal probability distribution. H₂: The population has a normal probability distribution. Ho: The population has a normal probability distribution. H₂: The population has a x² distribution. O Ho: The population has a normal probability distribution. H₂: The population does not have a normal probability distribution. Find the value of the test statistic. Find the p-value. (Round your answer to four decimal places.) p-value= State your conclusion. Do not reject Ho. We conclude that the population has a normal probability distribution. Reject Ho. We conclude that the population has a normal probability distribution. Do not reject Ho. We conclude that the population does not have a normal probability distribution. Reject Ho. We conclude that the population does not have a normal probability distribution.
You may need to use the appropriate technology to answer this question. Bob Feller, an Iowa farmer, has recorded the daily high temperatures during the same five-day stretch in May over the past five years. Bob is interested in whether this data suggests that the daily high temperature obeys a normal distribution. Use a = 0.01 and conduct a goodness of fit test using 5 classes to see whether the following sample appears to have been selected from a normal probability distribution. (Note: x = 70.4 and s = 17.) 54 85 93 57 54 94 54 51 68 94 89 64 86 49 55 54 56 97 57 78 91 61 58 87 74 State the null and alternative hypotheses. Ho: The population has a normal probability distribution. Ha: The population has a sampling mean distribution. O Ho: The population does not have a normal probability distribution. H₂: The population has a normal probability distribution. Ho: The population has a normal probability distribution. H₂: The population has a x² distribution. O Ho: The population has a normal probability distribution. H₂: The population does not have a normal probability distribution. Find the value of the test statistic. Find the p-value. (Round your answer to four decimal places.) p-value= State your conclusion. Do not reject Ho. We conclude that the population has a normal probability distribution. Reject Ho. We conclude that the population has a normal probability distribution. Do not reject Ho. We conclude that the population does not have a normal probability distribution. Reject Ho. We conclude that the population does not have a normal probability distribution.

Chapter8: Sequences, Series,and Probability
Section8.7: Probability
Problem 11ECP: A manufacturer has determined that a machine averages one faulty unit for every 500 it produces....

Related questions
Question
Ch 13
Transcribed Image Text:You may need to use the appropriate technology to answer this question.
Bob Feller, an Iowa farmer, has recorded the daily high temperatures during the same five-day stretch in May over the past five
years. Bob is interested in whether this data suggests that the daily high temperature obeys a normal distribution. Use a = 0.01
and conduct a goodness of fit test using 5 classes to see whether the following sample appears to have been selected from a
normal probability distribution. (Note: x= 70.4 and s = 17.)
State the null and alternative hypotheses.
O Ho: The population has a normal probability distribution.
H₂: The population has a sampling mean distribution.
O Ho: The population has a normal probability distribution.
H₂: The population has a x2 distribution.
Ho: The population does not have a normal probability distribution.
H₂: The population has a normal probability distribution.
OHO: The population has a normal probability distribution.
H₂: The population does not have a normal probability distribution.
Find the value of the test statistic.
O
Find the p-value. (Round your answer to four decimal places.)
p-value =
54 85 93 57
57 54 94 54 51 68 94 89
54
58 87 74
Frequency
56 97 57
State your conclusion.
O Do not reject Ho. We conclude that the population has a normal probability distribution.
O Reject Ho. We conclude that the population has a normal probability distribution.
O Do not reject Ho. We conclude that the population does not have a normal probability distribution.
O Reject Ho. We conclude that the population does not have a normal probability distribution.
Construct a histogram of the data.
Frequency
15
10
57 78 91 61
5
15
0
0
20
20
60
40
Percentage of Data
40
60
Percentage of Data
80
80
89 64 86 49 55
100
100
Frequency
Frequency
15
10
15
10
0
0
20
20
40
60
Percentage of Data
40
60
Percentage of Data
80
80
Does the histogram representation support the conclusion reached with the goodness of fit test?
Yes, the histogram representation supports the conclusion reached with the goodness of fit test.
No, the histogram representation does not support the conclusion reached with the goodness of fit test.
100
100
Ⓡ
Expert Solution
This question has been solved!
Explore an expertly crafted, step-by-step solution for a thorough understanding of key concepts.

This is a popular solution!

Trending now
This is a popular solution!

Step by step
Solved in 3 steps

Recommended textbooks for you
