The table shows the annual compensation of 0 randomly chosen CEOS (millions of dollars). 4.71 194.14 86.18 1.85 19.06 15.28 15.41 15.43 24.82 24.59 26.55 19.51 22.71 8.05 8.90 4.94 5.20 6.71 12.43 11.58 11.24 8.82 5.40 16.20 7.36 2.88 4.45 1.79 2.89 1.23 0.59 1.01 5.36 2.92 4.71 23.85 33.41 4.49 8.21 2.08 Click here for the Excel Data File a) Select the correct histogram for the above data. Histogram A Histogram B Histogram C Histogram Histogram Histogram 40 40 35 35 35 30 30 25 25 20 20 15 15 10 10 5 Compensation Compensation Compensation O Histogram A Histogram B O Histogram C Percent Percent Percent
The table shows the annual compensation of 0 randomly chosen CEOS (millions of dollars). 4.71 194.14 86.18 1.85 19.06 15.28 15.41 15.43 24.82 24.59 26.55 19.51 22.71 8.05 8.90 4.94 5.20 6.71 12.43 11.58 11.24 8.82 5.40 16.20 7.36 2.88 4.45 1.79 2.89 1.23 0.59 1.01 5.36 2.92 4.71 23.85 33.41 4.49 8.21 2.08 Click here for the Excel Data File a) Select the correct histogram for the above data. Histogram A Histogram B Histogram C Histogram Histogram Histogram 40 40 35 35 35 30 30 25 25 20 20 15 15 10 10 5 Compensation Compensation Compensation O Histogram A Histogram B O Histogram C Percent Percent Percent

MATLAB: An Introduction with Applications
6th Edition
ISBN:9781119256830
Author:Amos Gilat
Publisher:Amos Gilat
Chapter1: Starting With Matlab
Section: Chapter Questions
Problem 1P

Related questions
Question
100%
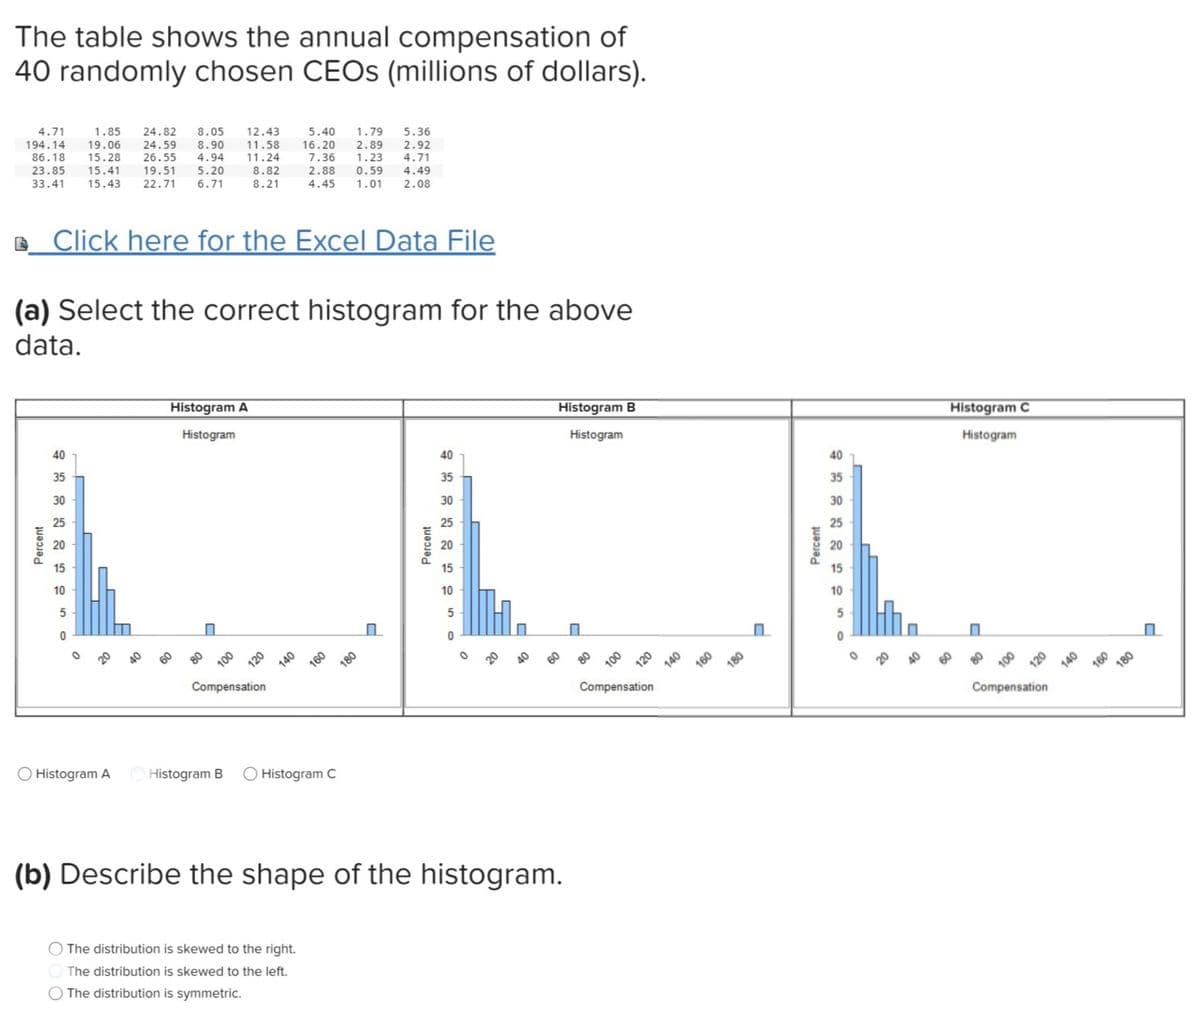
The table shows the annual compensation of 40 randomly chosen CEOs (millions of dollars).
| 4.71 | 1.85 | 24.82 | 8.05 | 12.43 | 5.40 | 1.79 | 5.36 |
| 194.14 | 19.06 | 24.59 | 8.90 | 11.58 | 16.20 | 2.89 | 2.92 |
| 86.18 | 15.28 | 26.55 | 4.94 | 11.24 | 7.36 | 1.23 | 4.71 |
| 23.85 | 15.41 | 19.51 | 5.20 | 8.82 | 2.88 | 0.59 | 4.49 |
| 33.41 | 15.43 | 22.71 | 6.71 | 8.21 | 4.45 | 1.01 | 2.08 |
(a) Select the correct histogram for the above data.
| Histogram A | Histogram B | Histogram C |
|---|---|---|
A. Histogram A
B. Histogram B
C. Histogram C
(b) Describe the shape of the histogram.
A. The distribution is skewed to the right.
B. The distribution is skewed to the left.
C. The distribution is symmetric.
Transcribed Image Text:The table shows the annual compensation of
40 randomly chosen CEOS (millions of dollars).
4.71
1.85
194.14
24.82
8.05
12.43
19.06
15.28
24.59
5.40
8.90
4.94
1.79
2.89
5.36
2.92
86.18
11.58
11.24
16.20
7.36
26.55
23.85
15.41
19.51
5.20
1.23
4.71
33.41
8.82
8.21
15.43
22.71
2.88
0.59
6.71
4.49
4.45
1.01
2.08
. Click here for the Excel Data File
(a) Select the correct histogram for the above
data.
Histogram A
Histogram
Histogram B
40
Histogram
Histogram C
35
40
Histogram
30
35
40
25
30
35
20
25
30
15
20
25
10
15
20
5
10
15
5
10
5
100
160
180
Compensation
160
180
Compensation
100
160
180
Compensation
O Histogram A O Histogram B
O Histogram C
(b) Describe the shape of the histogram.
The distribution is skewed to the right.
The distribution is skewed to the left.
The distribution is symmetric.
Percent
140
Percent
Percent
Expert Solution
This question has been solved!
Explore an expertly crafted, step-by-step solution for a thorough understanding of key concepts.

This is a popular solution!

Trending now
This is a popular solution!

Step by step
Solved in 2 steps with 1 images

Recommended textbooks for you
MATLAB: An Introduction with Applications
Statistics
ISBN:
9781119256830
Author:
Amos Gilat
Publisher:
John Wiley & Sons Inc

Probability and Statistics for Engineering and th…
Statistics
ISBN:
9781305251809
Author:
Jay L. Devore
Publisher:
Cengage Learning

Statistics for The Behavioral Sciences (MindTap C…
Statistics
ISBN:
9781305504912
Author:
Frederick J Gravetter, Larry B. Wallnau
Publisher:
Cengage Learning
MATLAB: An Introduction with Applications
Statistics
ISBN:
9781119256830
Author:
Amos Gilat
Publisher:
John Wiley & Sons Inc
Probability and Statistics for Engineering and th…
Statistics
ISBN:
9781305251809
Author:
Jay L. Devore
Publisher:
Cengage Learning
Statistics for The Behavioral Sciences (MindTap C…
Statistics
ISBN:
9781305504912
Author:
Frederick J Gravetter, Larry B. Wallnau
Publisher:
Cengage Learning

Elementary Statistics: Picturing the World (7th E…
Statistics
ISBN:
9780134683416
Author:
Ron Larson, Betsy Farber
Publisher:
PEARSON

The Basic Practice of Statistics
Statistics
ISBN:
9781319042578
Author:
David S. Moore, William I. Notz, Michael A. Fligner
Publisher:
W. H. Freeman

Introduction to the Practice of Statistics
Statistics
ISBN:
9781319013387
Author:
David S. Moore, George P. McCabe, Bruce A. Craig
Publisher:
W. H. Freeman