The table shows the estimated percentage P of the population of a certain country that are mobile-phone subscribers. (End of year estimates are given.) Year 1997 1999 2001 2003 2005 2007 1.8 7.9 15.4 24.7 45.4 62.2 (a) Find the average rate of change of P. (i) From 2003 to 2007 percentage points per year (ii) From 2003 to 2005 percentage points per year (iii) From 2001 to 2003 percentage points per year
The table shows the estimated percentage P of the population of a certain country that are mobile-phone subscribers. (End of year estimates are given.) Year 1997 1999 2001 2003 2005 2007 1.8 7.9 15.4 24.7 45.4 62.2 (a) Find the average rate of change of P. (i) From 2003 to 2007 percentage points per year (ii) From 2003 to 2005 percentage points per year (iii) From 2001 to 2003 percentage points per year

Algebra and Trigonometry (MindTap Course List)
4th Edition
ISBN:9781305071742
Author:James Stewart, Lothar Redlin, Saleem Watson
Publisher:James Stewart, Lothar Redlin, Saleem Watson
Chapter1: Equations And Graphs
Section1.2: Graphs Of Equations In Two Variables; Circles
Problem 111E

Related questions
Question
Ch2.3 #27
Can you help me with this please?
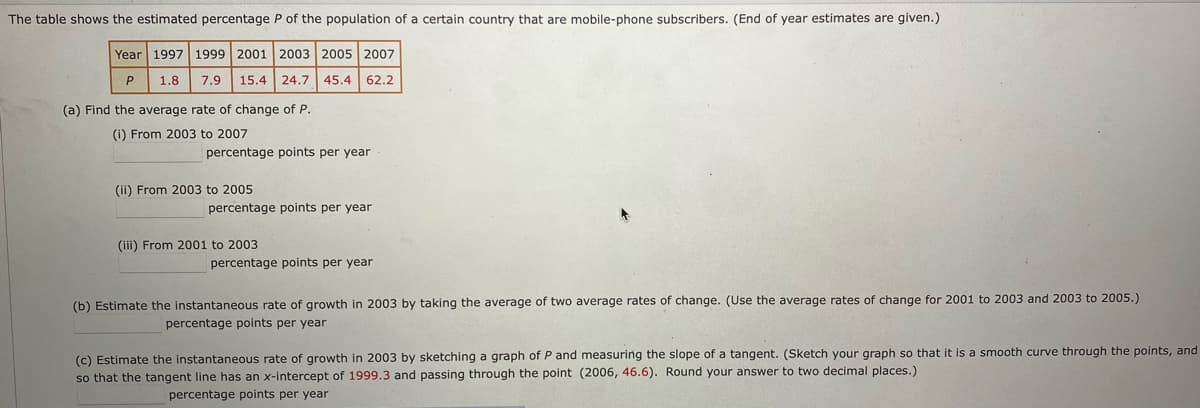
Transcribed Image Text:The table shows the estimated percentage P of the population of a certain country that are mobile-phone subscribers. (End of year estimates are given.)
Year 1997 1999 2001 2003 2005 2007
1.8
7.9
15.4 24.7
45.4 62.2
(a) Find the average rate of change of P.
(i) From 2003 to 2007
percentage points per year
(ii) From 2003 to 2005
percentage points per year
(iii) From 2001 to 2003
percentage points per year
(b) Estimate the instantaneous rate of growth in 2003 by taking the average of two average rates of change. (Use the average rates of change for 2001 to 2003 and 2003 to 2005.)
percentage points per year
(c) Estimate the instantaneous rate of growth in 2003 by sketching a graph of P and measuring the slope of a tangent. (Sketch your graph so that it is a smooth curve through the points, and
so that the tangent line has an x-intercept of 1999.3 and passing through the point (2006, 46.6). Round your answer to two decimal places.)
percentage points per year
Expert Solution
This question has been solved!
Explore an expertly crafted, step-by-step solution for a thorough understanding of key concepts.

This is a popular solution!

Trending now
This is a popular solution!

Step by step
Solved in 2 steps with 2 images

Recommended textbooks for you
Algebra and Trigonometry (MindTap Course List)
Algebra
ISBN:
9781305071742
Author:
James Stewart, Lothar Redlin, Saleem Watson
Publisher:
Cengage Learning


Big Ideas Math A Bridge To Success Algebra 1: Stu…
Algebra
ISBN:
9781680331141
Author:
HOUGHTON MIFFLIN HARCOURT
Publisher:
Houghton Mifflin Harcourt
Algebra and Trigonometry (MindTap Course List)
Algebra
ISBN:
9781305071742
Author:
James Stewart, Lothar Redlin, Saleem Watson
Publisher:
Cengage Learning
Big Ideas Math A Bridge To Success Algebra 1: Stu…
Algebra
ISBN:
9781680331141
Author:
HOUGHTON MIFFLIN HARCOURT
Publisher:
Houghton Mifflin Harcourt


Trigonometry (MindTap Course List)
Trigonometry
ISBN:
9781337278461
Author:
Ron Larson
Publisher:
Cengage Learning

College Algebra (MindTap Course List)
Algebra
ISBN:
9781305652231
Author:
R. David Gustafson, Jeff Hughes
Publisher:
Cengage Learning