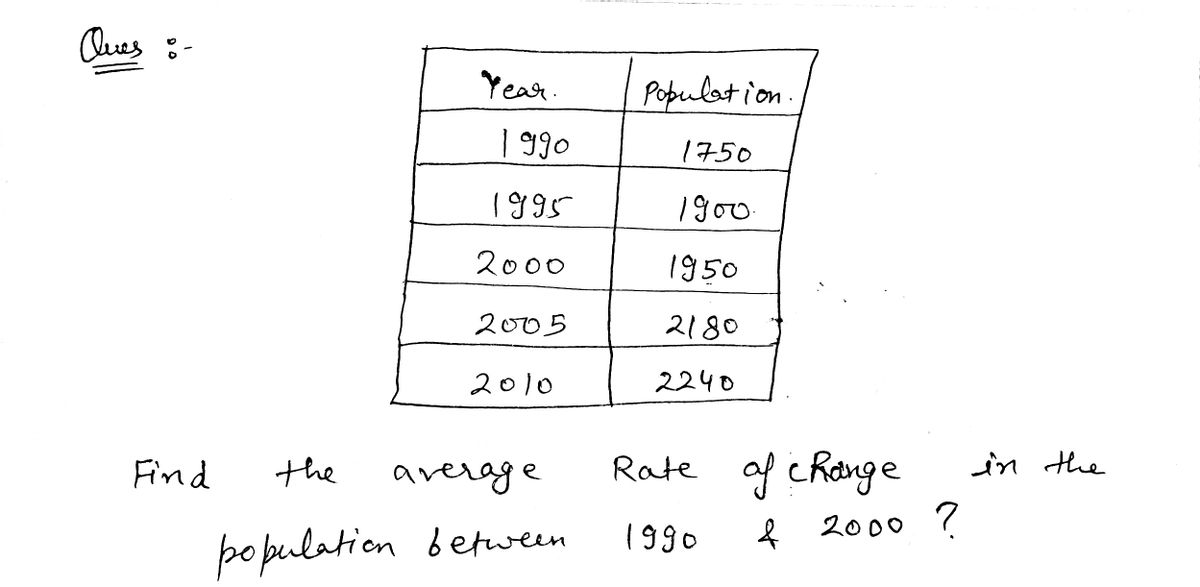
6. The population of one variety of frogs in a nature preserve is listed in the table below. Year 1990 Population 1,750 1,900 1,950 2,180 2,240 1995 2000 2005 2010 What was the average rate of change in the population between 1990 and 2000? A 20 frogs per year B. 24.5 frogs per year C. 28.7 frogs per year
6. The population of one variety of frogs in a nature preserve is listed in the table below. Year 1990 Population 1,750 1,900 1,950 2,180 2,240 1995 2000 2005 2010 What was the average rate of change in the population between 1990 and 2000? A 20 frogs per year B. 24.5 frogs per year C. 28.7 frogs per year

Chapter3: Functions
Section3.3: Rates Of Change And Behavior Of Graphs
Problem 27SE: Table 4 gives the population of a town (in thousand) from 2000 to 2008. What was the average rate of...

Related questions

Question
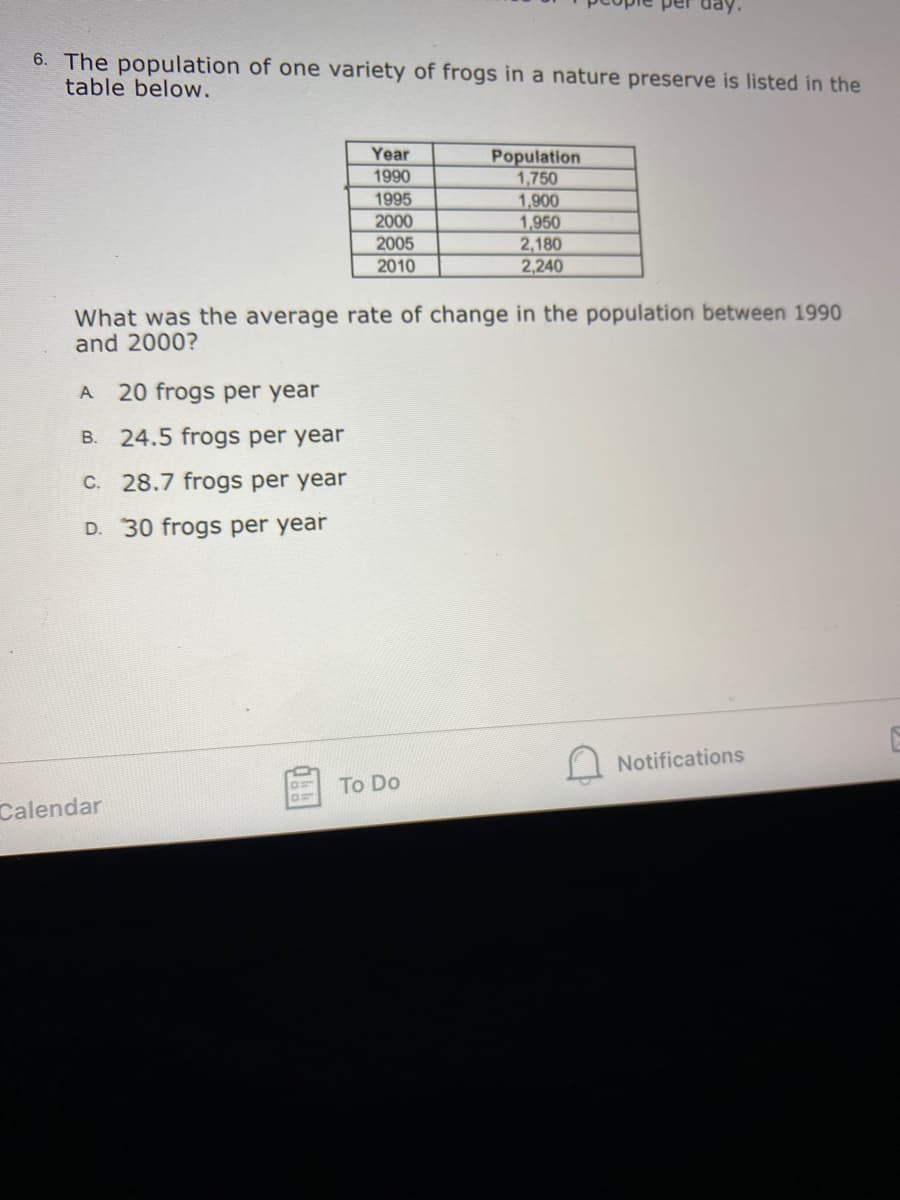
Transcribed Image Text:6. The population of one variety of frogs in a nature preserve is listed in the
table below.
IT
Year
Population
1,750
1,900
1,950
2,180
2,240
1990
1995
2000
2005
2010
What was the average rate of change in the population between 1990
and 2000?
A
20 frogs per year
B. 24.5 frogs per year
C. 28.7 frogs per year
D. 30 frogs per year
Notifications
To Do
Calendar
Expert Solution
Step 1

Trending now
This is a popular solution!

Step by step
Solved in 2 steps with 2 images

Knowledge Booster


Learn more about
Need a deep-dive on the concept behind this application? Look no further. Learn more about this topic, algebra and related others by exploring similar questions and additional content below.Recommended textbooks for you

Algebra & Trigonometry with Analytic Geometry
Algebra
ISBN:
9781133382119
Author:
Swokowski
Publisher:
Cengage

Functions and Change: A Modeling Approach to Coll…
Algebra
ISBN:
9781337111348
Author:
Bruce Crauder, Benny Evans, Alan Noell
Publisher:
Cengage Learning
Algebra & Trigonometry with Analytic Geometry
Algebra
ISBN:
9781133382119
Author:
Swokowski
Publisher:
Cengage
Functions and Change: A Modeling Approach to Coll…
Algebra
ISBN:
9781337111348
Author:
Bruce Crauder, Benny Evans, Alan Noell
Publisher:
Cengage Learning

Algebra and Trigonometry (MindTap Course List)
Algebra
ISBN:
9781305071742
Author:
James Stewart, Lothar Redlin, Saleem Watson
Publisher:
Cengage Learning

Trigonometry (MindTap Course List)
Trigonometry
ISBN:
9781337278461
Author:
Ron Larson
Publisher:
Cengage Learning
