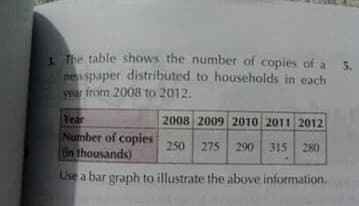
The table shows the number of copies of a newspaper distributed to households in each year from 2008 to 2012. Year Number of copies Gn thousands) 2008 2009 2010 2011 2012 250 275 290 315 280 Use a bar graph to illustrate the above information.
The table shows the number of copies of a newspaper distributed to households in each year from 2008 to 2012. Year Number of copies Gn thousands) 2008 2009 2010 2011 2012 250 275 290 315 280 Use a bar graph to illustrate the above information.

Glencoe Algebra 1, Student Edition, 9780079039897, 0079039898, 2018
18th Edition
ISBN:9780079039897
Author:Carter
Publisher:Carter
Chapter10: Statistics
Section10.6: Summarizing Categorical Data
Problem 1CGP

Related questions

Question
100%
Transcribed Image Text:The table shows the number of copies of a
newspaper distributed to households in each
year from 2008 to 2012.
5.
Year
Number of copies
Gn thousands)
2008 2009 2010 2011 2012
250 275 290
315 280
Use a bar graph to illustrate the above information.
Expert Solution
This question has been solved!
Explore an expertly crafted, step-by-step solution for a thorough understanding of key concepts.

This is a popular solution!

Trending now
This is a popular solution!

Step by step
Solved in 2 steps with 1 images

Knowledge Booster


Learn more about
Need a deep-dive on the concept behind this application? Look no further. Learn more about this topic, probability and related others by exploring similar questions and additional content below.Recommended textbooks for you
Glencoe Algebra 1, Student Edition, 9780079039897…
Algebra
ISBN:
9780079039897
Author:
Carter
Publisher:
McGraw Hill

Holt Mcdougal Larson Pre-algebra: Student Edition…
Algebra
ISBN:
9780547587776
Author:
HOLT MCDOUGAL
Publisher:
HOLT MCDOUGAL
Glencoe Algebra 1, Student Edition, 9780079039897…
Algebra
ISBN:
9780079039897
Author:
Carter
Publisher:
McGraw Hill
Holt Mcdougal Larson Pre-algebra: Student Edition…
Algebra
ISBN:
9780547587776
Author:
HOLT MCDOUGAL
Publisher:
HOLT MCDOUGAL