The table to the right contains observed values and expected values in parentheses for two categorical variables, X and Y, where variable X has three categories and variable Y has two categories. Use the table to complete parts (a) and (b) below. Click the icon to view the Chi-Square table of critical values. (a) Compute the value of the chi-square test statistic. x = (Round to three decimal places as needed.) (b) Test the hypothesis that X and Y are independent at the a= 0.05 level of significance. OA. Ho: The Y category and X category have equal proportions. H₁: The proportions are not equal. OB. Ho: The Y category and X category are independent. H₁: The Y category and X category are dependent. OC. H: The Y category and X category are dependent. H₁: The Y category and X category are independent. OD. Ho: Ex and μ = Ey H₁: #Ex or μy #Ey What range of P-values does the test statistic correspond to? The P-value is Should the null hypothesis be rejected? O A. Yes, reject Ho. There is not sufficient evidence at the a= 0.05 level of significance to conclude that X and Y are dependent because the P-value>< O B. No, do not reject Ho. There is sufficient evidence at the a= 0.05 level of significance to conclude that X and Y are dependent because the P-value a O D. Yes, reject Ho. There is not sufficient evidence at the a= 0.05 level of significance to conclude that X and Y are dependent because the P-value
The table to the right contains observed values and expected values in parentheses for two categorical variables, X and Y, where variable X has three categories and variable Y has two categories. Use the table to complete parts (a) and (b) below. Click the icon to view the Chi-Square table of critical values. (a) Compute the value of the chi-square test statistic. x = (Round to three decimal places as needed.) (b) Test the hypothesis that X and Y are independent at the a= 0.05 level of significance. OA. Ho: The Y category and X category have equal proportions. H₁: The proportions are not equal. OB. Ho: The Y category and X category are independent. H₁: The Y category and X category are dependent. OC. H: The Y category and X category are dependent. H₁: The Y category and X category are independent. OD. Ho: Ex and μ = Ey H₁: #Ex or μy #Ey What range of P-values does the test statistic correspond to? The P-value is Should the null hypothesis be rejected? O A. Yes, reject Ho. There is not sufficient evidence at the a= 0.05 level of significance to conclude that X and Y are dependent because the P-value>< O B. No, do not reject Ho. There is sufficient evidence at the a= 0.05 level of significance to conclude that X and Y are dependent because the P-value a O D. Yes, reject Ho. There is not sufficient evidence at the a= 0.05 level of significance to conclude that X and Y are dependent because the P-value

College Algebra (MindTap Course List)
12th Edition
ISBN:9781305652231
Author:R. David Gustafson, Jeff Hughes
Publisher:R. David Gustafson, Jeff Hughes
Chapter8: Sequences, Series, And Probability
Section8.7: Probability
Problem 58E: What is meant by the sample space of an experiment?

Related questions
Question
100%
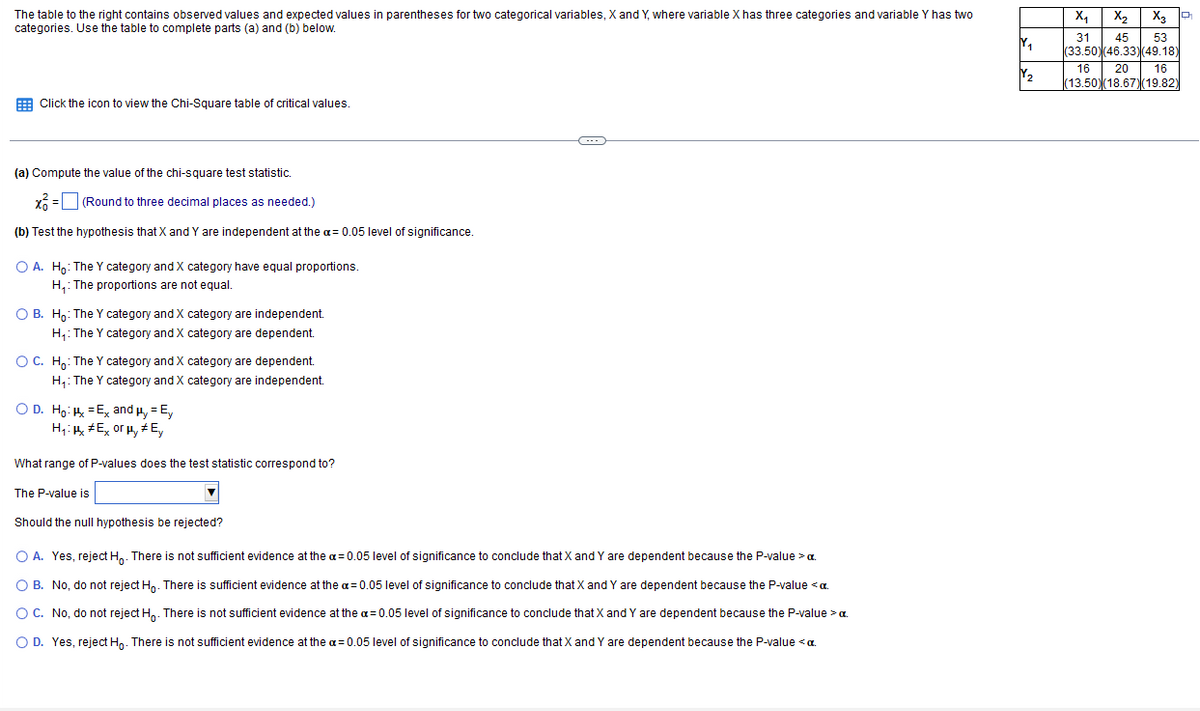
Transcribed Image Text:The table to the right contains observed values and expected values in parentheses for two categorical variables, X and Y, where variable X has three categories and variable Y has two
categories. Use the table to complete parts (a) and (b) below.
Click the icon to view the Chi-Square table of critical values.
(a) Compute the value of the chi-square test statistic.
x=(Round to three decimal places as needed.)
(b) Test the hypothesis that X and Y are independent at the a= 0.05 level of significance.
O A. Ho: The Y category and X category have equal proportions.
H₁: The proportions are not equal.
O B. Ho: The Y category and X category are independent.
H₁: The Y category and X category are dependent.
OC. Ho: The Y category and X category are dependent.
H₁: The Y category and X category are independent.
O D. Ho:
Ex and μy = Ey
H₁: #Ex or μy # Ey
What range of P-values does the test statistic correspond to?
The P-value is
Should the null hypothesis be rejected?
O A. Yes, reject Ho. There is not sufficient evidence at the a= 0.05 level of significance to conclude that X and Y are dependent because the P-value > α.
O B. No, do not reject Ho. There is sufficient evidence at the a= 0.05 level of significance to conclude that X and Y are dependent because the P-value <α.
O C. No, do not reject Ho. There is not sufficient evidence at the a= 0.05 level of significance to conclude that X and Y are dependent because the P-value > α.
O D. Yes, reject Ho. There is not sufficient evidence at the a= 0.05 level of significance to conclude that X and Y are dependent because the P-value < α.
M₁₂₁
Y₂
X₁
31 45 53
(33.50) (46.33) (49.18)
X₂ X3 P
16 20 16
(13.50) (18.67) (19.82)
Expert Solution
This question has been solved!
Explore an expertly crafted, step-by-step solution for a thorough understanding of key concepts.

This is a popular solution!

Trending now
This is a popular solution!

Step by step
Solved in 3 steps with 1 images

Recommended textbooks for you
College Algebra (MindTap Course List)
Algebra
ISBN:
9781305652231
Author:
R. David Gustafson, Jeff Hughes
Publisher:
Cengage Learning
College Algebra (MindTap Course List)
Algebra
ISBN:
9781305652231
Author:
R. David Gustafson, Jeff Hughes
Publisher:
Cengage Learning