The table to the right shows the number of female students who played on a sports team in grades 9thvough 12 for a random sample of 6high schools in a state. At a0.10, can you reject the caim that the mean numbers of female students who played on a sports team are equal for all grades? Perfom a oneway ANOVA test by completing parts a thvough d. Assume that each sample in drawn from a nomal population, hat he samples are independent of each other, and hat he populations have the same variances. 10 1 115 94 (a) identify the claim and state H and Choose the comect answer below OA "a " " (claim) OB H a s HAl least one mean is diferent trom the others H Al least one mean is different from the others. (claim) OC. H Atleast one mean is diferent trom the others. (claim) H " """s " HAl least one mean is different from the others (claim) (b) ldentify the degrees of freedom for the numerator and for the denominator, determine the critical value, and determine the rejection region. The degrees of freedom for the numerator, df i and the degrees of theedom for the denominator, dfo iO The criical value is Fa-O (Round to two decimal places as needed) The rejection region is F n (Round to two decimal places as needed) (e) Calulate the test statistic (Round to thvee decimal places as needed.) (4) Decide to reject or fail to reject e nulhypothesis and interpret the decision in the context of the original claim. Choose the corect decision below. OA Since Fisin he reection region, reject H O. Since Fis not in the rejection region, falto reject H OC. Since Fis not in the rejection region, reject H OD. Since Fis in he rejection region, fail to reject H Interpret the deciion in the context of the original claim There enough evidence at the 10% significance level to he claim that the mean numbers of female students who played on a sports team is
The table to the right shows the number of female students who played on a sports team in grades 9thvough 12 for a random sample of 6high schools in a state. At a0.10, can you reject the caim that the mean numbers of female students who played on a sports team are equal for all grades? Perfom a oneway ANOVA test by completing parts a thvough d. Assume that each sample in drawn from a nomal population, hat he samples are independent of each other, and hat he populations have the same variances. 10 1 115 94 (a) identify the claim and state H and Choose the comect answer below OA "a " " (claim) OB H a s HAl least one mean is diferent trom the others H Al least one mean is different from the others. (claim) OC. H Atleast one mean is diferent trom the others. (claim) H " """s " HAl least one mean is different from the others (claim) (b) ldentify the degrees of freedom for the numerator and for the denominator, determine the critical value, and determine the rejection region. The degrees of freedom for the numerator, df i and the degrees of theedom for the denominator, dfo iO The criical value is Fa-O (Round to two decimal places as needed) The rejection region is F n (Round to two decimal places as needed) (e) Calulate the test statistic (Round to thvee decimal places as needed.) (4) Decide to reject or fail to reject e nulhypothesis and interpret the decision in the context of the original claim. Choose the corect decision below. OA Since Fisin he reection region, reject H O. Since Fis not in the rejection region, falto reject H OC. Since Fis not in the rejection region, reject H OD. Since Fis in he rejection region, fail to reject H Interpret the deciion in the context of the original claim There enough evidence at the 10% significance level to he claim that the mean numbers of female students who played on a sports team is

MATLAB: An Introduction with Applications
6th Edition
ISBN:9781119256830
Author:Amos Gilat
Publisher:Amos Gilat
Chapter1: Starting With Matlab
Section: Chapter Questions
Problem 1P

Related questions

Concept explainers
Contingency Table
A contingency table can be defined as the visual representation of the relationship between two or more categorical variables that can be evaluated and registered. It is a categorical version of the scatterplot, which is used to investigate the linear relationship between two variables. A contingency table is indeed a type of frequency distribution table that displays two variables at the same time.
Binomial Distribution
Binomial is an algebraic expression of the sum or the difference of two terms. Before knowing about binomial distribution, we must know about the binomial theorem.
Topic Video
Question
14
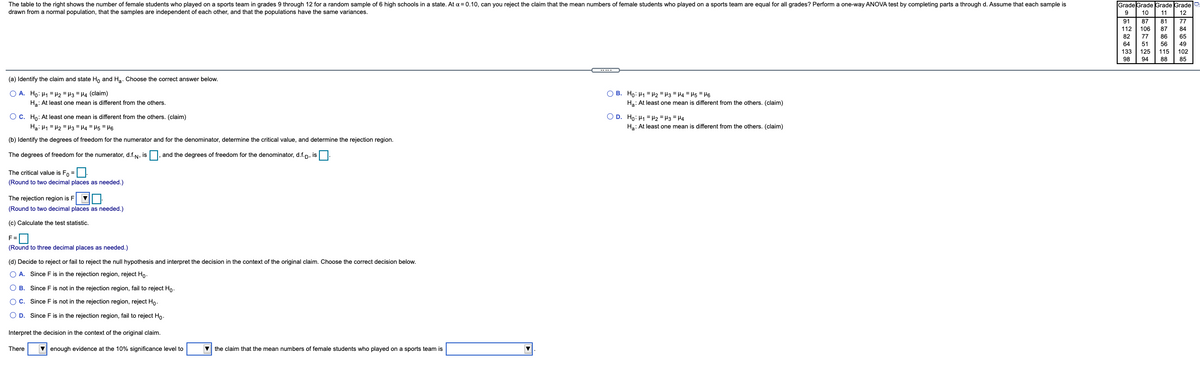
Transcribed Image Text:Grade Grade Grade Grade e
The table to the right shows the number of female students who played on a sports team in grades 9 through 12 for a random sample of 6 high schools in a state. At a = 0.10, can you reject the claim that the mean numbers of female students who played on a sports team are equal for all grades? Perform a one-way ANOVA test by completing parts a through d. Assume that each sample is
drawn from a normal population, that the samples are independent of each other, and that the populations have the same variances.
9
10
11
12
91
87
81
77
112
106
87
84
82
77
86
65
64
51
56
49
133
125
115
102
98
94
88
85
(a) Identify the claim and state Ho and Ha. Choose the correct answer below.
O A. Ho: H1 = H2 = H3 = H4 (claim)
O B. Ho: H1 = H2 = H3 = H4 = H5 = H6
Ha: At least one mean
s different from the others.
Ha: At least one mean is different from the others. (claim)
OC. Ho: At least one mean is different from the others. (claim)
O D. Ho: H1 = H2 =H3 = H4
Ha: H1 = H2 = H3 = H4 = H5 = H6
Ha: At least one mean is different from the others. (claim)
(b) Identify the degrees of freedom for the numerator and for the denominator, determine the critical value, and determine the rejection region.
The degrees of freedom for the numerator, d.f.N,
,is
and the degrees of freedom for the denominator, d.f.p, is
The critical value is Fo =
(Round to two decimal places as needed.)
The rejection region is F |
(Round to two decimal places as needed.)
(c) Calculate the test statistic.
F=
(Round to three decimal places as needed.)
(d) Decide to reject or fail to reject the null hypothesis and interpret the decision in the context of the original claim. Choose the correct decision below.
O A. Since F is in the rejection region, reject Ho.
O B. Since F is not in the rejection region, fail to reject Ho:
O C. Since F is not in the rejection region, reject Ho.
O D. Since F is in the rejection region, fail to reject Ho.
Interpret the decision in the context of the original claim.
There
V enough evidence at the 10% significance level to
V the claim that the mean numbers of female students who played on a sports team is
Expert Solution
This question has been solved!
Explore an expertly crafted, step-by-step solution for a thorough understanding of key concepts.

This is a popular solution!

Trending now
This is a popular solution!

Step by step
Solved in 2 steps

Knowledge Booster


Learn more about
Need a deep-dive on the concept behind this application? Look no further. Learn more about this topic, statistics and related others by exploring similar questions and additional content below.Recommended textbooks for you
MATLAB: An Introduction with Applications
Statistics
ISBN:
9781119256830
Author:
Amos Gilat
Publisher:
John Wiley & Sons Inc

Probability and Statistics for Engineering and th…
Statistics
ISBN:
9781305251809
Author:
Jay L. Devore
Publisher:
Cengage Learning

Statistics for The Behavioral Sciences (MindTap C…
Statistics
ISBN:
9781305504912
Author:
Frederick J Gravetter, Larry B. Wallnau
Publisher:
Cengage Learning
MATLAB: An Introduction with Applications
Statistics
ISBN:
9781119256830
Author:
Amos Gilat
Publisher:
John Wiley & Sons Inc
Probability and Statistics for Engineering and th…
Statistics
ISBN:
9781305251809
Author:
Jay L. Devore
Publisher:
Cengage Learning
Statistics for The Behavioral Sciences (MindTap C…
Statistics
ISBN:
9781305504912
Author:
Frederick J Gravetter, Larry B. Wallnau
Publisher:
Cengage Learning

Elementary Statistics: Picturing the World (7th E…
Statistics
ISBN:
9780134683416
Author:
Ron Larson, Betsy Farber
Publisher:
PEARSON

The Basic Practice of Statistics
Statistics
ISBN:
9781319042578
Author:
David S. Moore, William I. Notz, Michael A. Fligner
Publisher:
W. H. Freeman

Introduction to the Practice of Statistics
Statistics
ISBN:
9781319013387
Author:
David S. Moore, George P. McCabe, Bruce A. Craig
Publisher:
W. H. Freeman