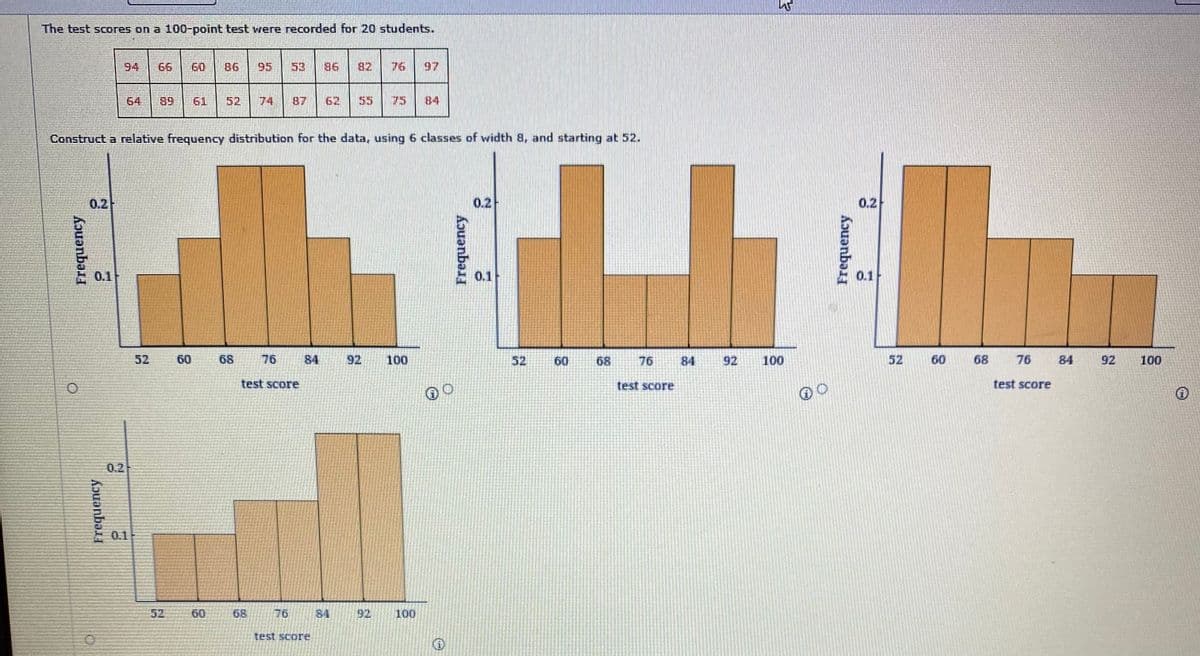
The test scores on a 100-point test were recorded for 20 students. 94 66 60 86 95 53 86 82 76 97 64 89 61 52 74 87 62 55 75 84 Construct a relative frequency distribution for the data, using 6 classes of width 8, and starting at 52. 0.2 0.2 0.2 0.2 0.1 0.1 0.1 52 60 68 76 84 92 100 52 60 68 76 84 92 100 52 60 68 76 84 92 100 test score test score test score Frequency
The test scores on a 100-point test were recorded for 20 students. 94 66 60 86 95 53 86 82 76 97 64 89 61 52 74 87 62 55 75 84 Construct a relative frequency distribution for the data, using 6 classes of width 8, and starting at 52. 0.2 0.2 0.2 0.2 0.1 0.1 0.1 52 60 68 76 84 92 100 52 60 68 76 84 92 100 52 60 68 76 84 92 100 test score test score test score Frequency

Glencoe Algebra 1, Student Edition, 9780079039897, 0079039898, 2018
18th Edition
ISBN:9780079039897
Author:Carter
Publisher:Carter
Chapter10: Statistics
Section10.5: Comparing Sets Of Data
Problem 14PPS

Related questions

Concept explainers
Contingency Table
A contingency table can be defined as the visual representation of the relationship between two or more categorical variables that can be evaluated and registered. It is a categorical version of the scatterplot, which is used to investigate the linear relationship between two variables. A contingency table is indeed a type of frequency distribution table that displays two variables at the same time.
Binomial Distribution
Binomial is an algebraic expression of the sum or the difference of two terms. Before knowing about binomial distribution, we must know about the binomial theorem.
Topic Video
Question
This has 2 parts
Transcribed Image Text:52
60 68 76 84
92
52
60
68
76
84
92
100
000
test score
test score
0.2
0.1
52
60
68
76
84
92 100
test score
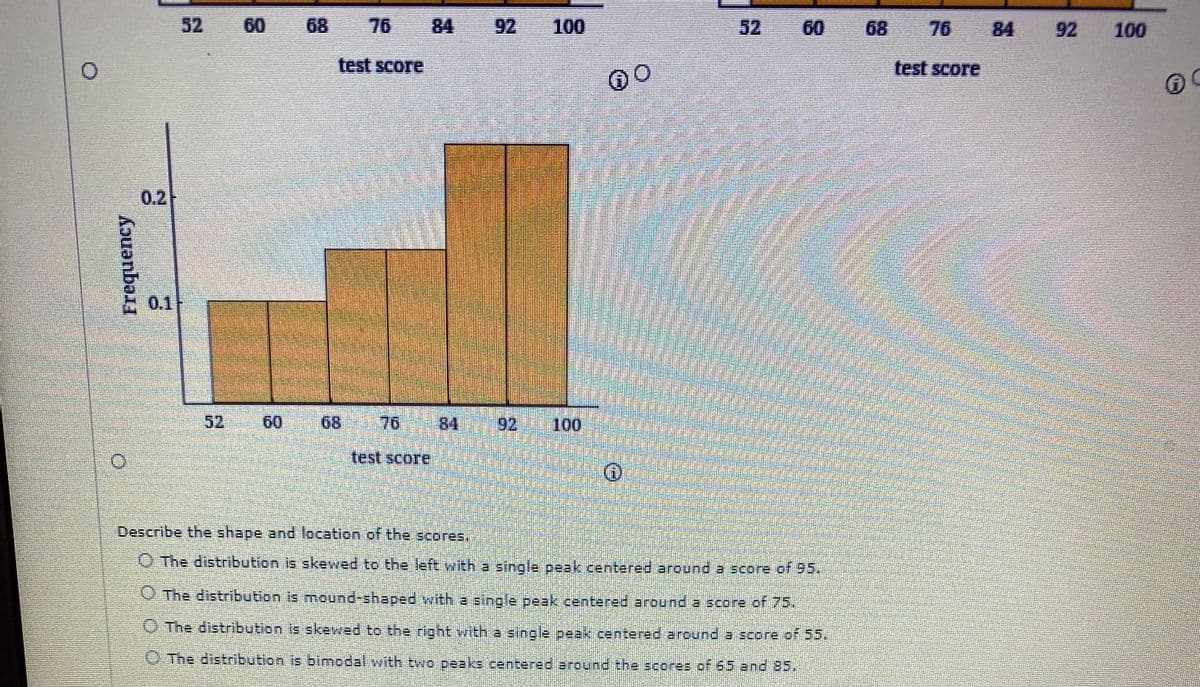
Describe the shape and location of the scores.
O The distribution is skewed to the left with a single peak centered around a score of 95.
O The distribution is mound-shaped with a single peak centered around a score of 75.
O The distribution is skewed to the right with a single peak centered around a score of 55.
O The distribution is bimodal with two peeks centered around the scores of 65 and 85.
Transcribed Image Text:The test scores on a 100-point test vwere recorded for 20 students.
94
66
60
B6
95
53
96
32
76
97
64
89
61
52
74
87
62
55
75
84
Construct a relative frequency distribution for the data, using 6 classes of width S, and starting at 52.
0.2
0.2
0.2
0.1
0.1
0.1
52
60
68
76
84
92
100
52
60
68
76
84
92
100
52
60
68
76
84
92
100
test score
test score
test score
0.2
0.1
52
60
68
76
84
92
100
test score
Frequency
Frequency
Frequency
Frequency
Expert Solution
This question has been solved!
Explore an expertly crafted, step-by-step solution for a thorough understanding of key concepts.

This is a popular solution!

Trending now
This is a popular solution!

Step by step
Solved in 2 steps with 1 images

Knowledge Booster


Learn more about
Need a deep-dive on the concept behind this application? Look no further. Learn more about this topic, statistics and related others by exploring similar questions and additional content below.Recommended textbooks for you
Glencoe Algebra 1, Student Edition, 9780079039897…
Algebra
ISBN:
9780079039897
Author:
Carter
Publisher:
McGraw Hill

Mathematics For Machine Technology
Advanced Math
ISBN:
9781337798310
Author:
Peterson, John.
Publisher:
Cengage Learning,
Glencoe Algebra 1, Student Edition, 9780079039897…
Algebra
ISBN:
9780079039897
Author:
Carter
Publisher:
McGraw Hill
Mathematics For Machine Technology
Advanced Math
ISBN:
9781337798310
Author:
Peterson, John.
Publisher:
Cengage Learning,