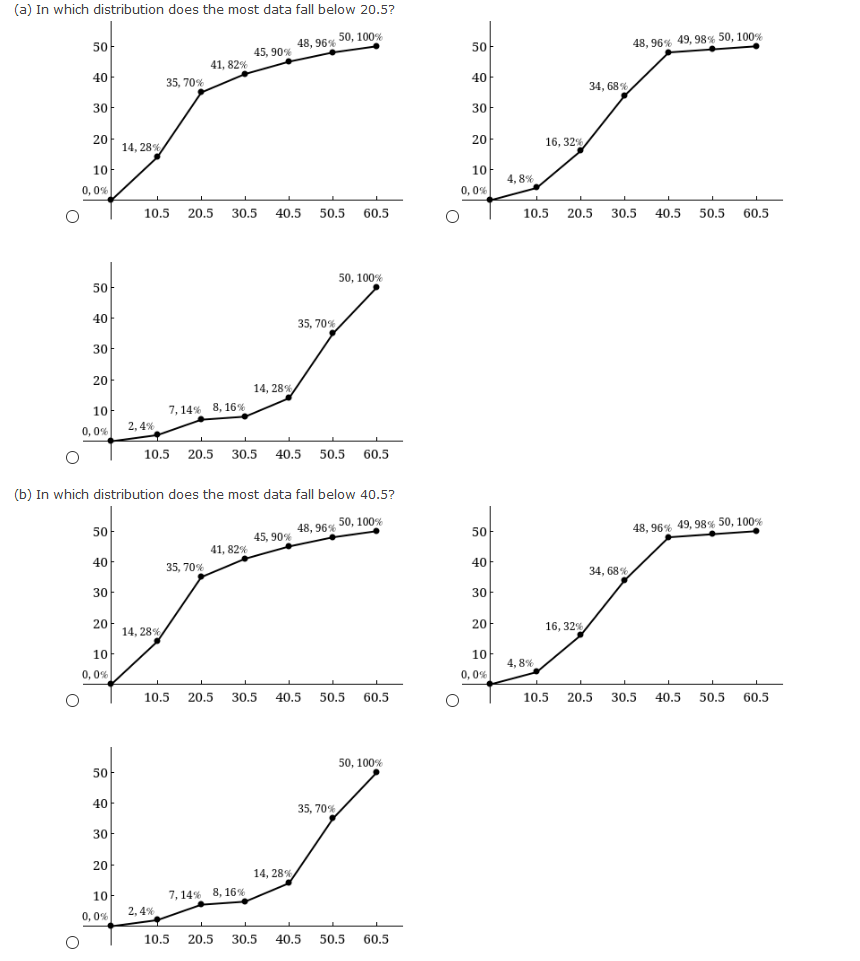
(a) In which distribution does the most data fall below 20.5? 50 48, 96% 50, 100% 48, 96% 49, 98% 50, 100% 50 45, 90% 41, 82% 4아 40 35, 70% 34, 68% 3아 3아 2아 14, 28% 2아 16, 32% 10 0, 0% 10 4, 8% 0,0% 10.5 20.5 30.5 40.5 50.5 60.5 10.5 20.5 30.5 40.5 50.5 60.5 50, 100% 5아 40 35, 70% 30 20 14, 28% 1아 7, 14% 8, 16% 0,0% 2, 4% 10.5 20.5 30.5 40.5 50.5 60.5 (b) In which distribution does the most data fall below 40.5? 48, 96% 50, 100% 45, 90% 5아 5아 48, 96% 49, 98% 50, 100% 4아 41, 82% 35, 70% 40 34, 68% 3아 3아 2아 14, 28% 2아 16, 32% 1아 10 4, 8% 0,0% 0,0% 10.5 20.5 30.5 40.5 50.5 60.5 10.5 20.5 30.5 40.5 50.5 60.5 50, 100% 5아 4아 35, 70% 30 20 14, 28% 10 7, 14% 8, 16% 0,0% 2,4% 10.5 20.5 30.5 40.5 50.5 60.5


Inverse Normal Distribution
The method used for finding the corresponding z-critical value in a normal distribution using the known probability is said to be an inverse normal distribution. The inverse normal distribution is a continuous probability distribution with a family of two parameters.
Mean, Median, Mode
It is a descriptive summary of a data set. It can be defined by using some of the measures. The central tendencies do not provide information regarding individual data from the dataset. However, they give a summary of the data set. The central tendency or measure of central tendency is a central or typical value for a probability distribution.
Z-Scores
A z-score is a unit of measurement used in statistics to describe the position of a raw score in terms of its distance from the mean, measured with reference to standard deviation from the mean. Z-scores are useful in statistics because they allow comparison between two scores that belong to different normal distributions.
The following ogives come from different distributions of 50 whole numbers between 1 and 60. Labels on each point give the cumulative frequency and the cumulative percentage of data.
(Graphs are same for part)


Trending now
This is a popular solution!

Step by step
Solved in 5 steps


