The time spent by a particular type of rat to find its way through a labyrinth is normally distributed with u = 1.5 min and o = 0.35 min. Five rats are selected, and the time spent by each rat through the labyrinth is measured. What is the
The time spent by a particular type of rat to find its way through a labyrinth is normally distributed with u = 1.5 min and o = 0.35 min. Five rats are selected, and the time spent by each rat through the labyrinth is measured. What is the

MATLAB: An Introduction with Applications
6th Edition
ISBN:9781119256830
Author:Amos Gilat
Publisher:Amos Gilat
Chapter1: Starting With Matlab
Section: Chapter Questions
Problem 1P

Related questions
Question
100%
Transcribed Image Text:Problem 1
probability of the total time the rats use through the labyrinth is between 6 and 8
minutes?
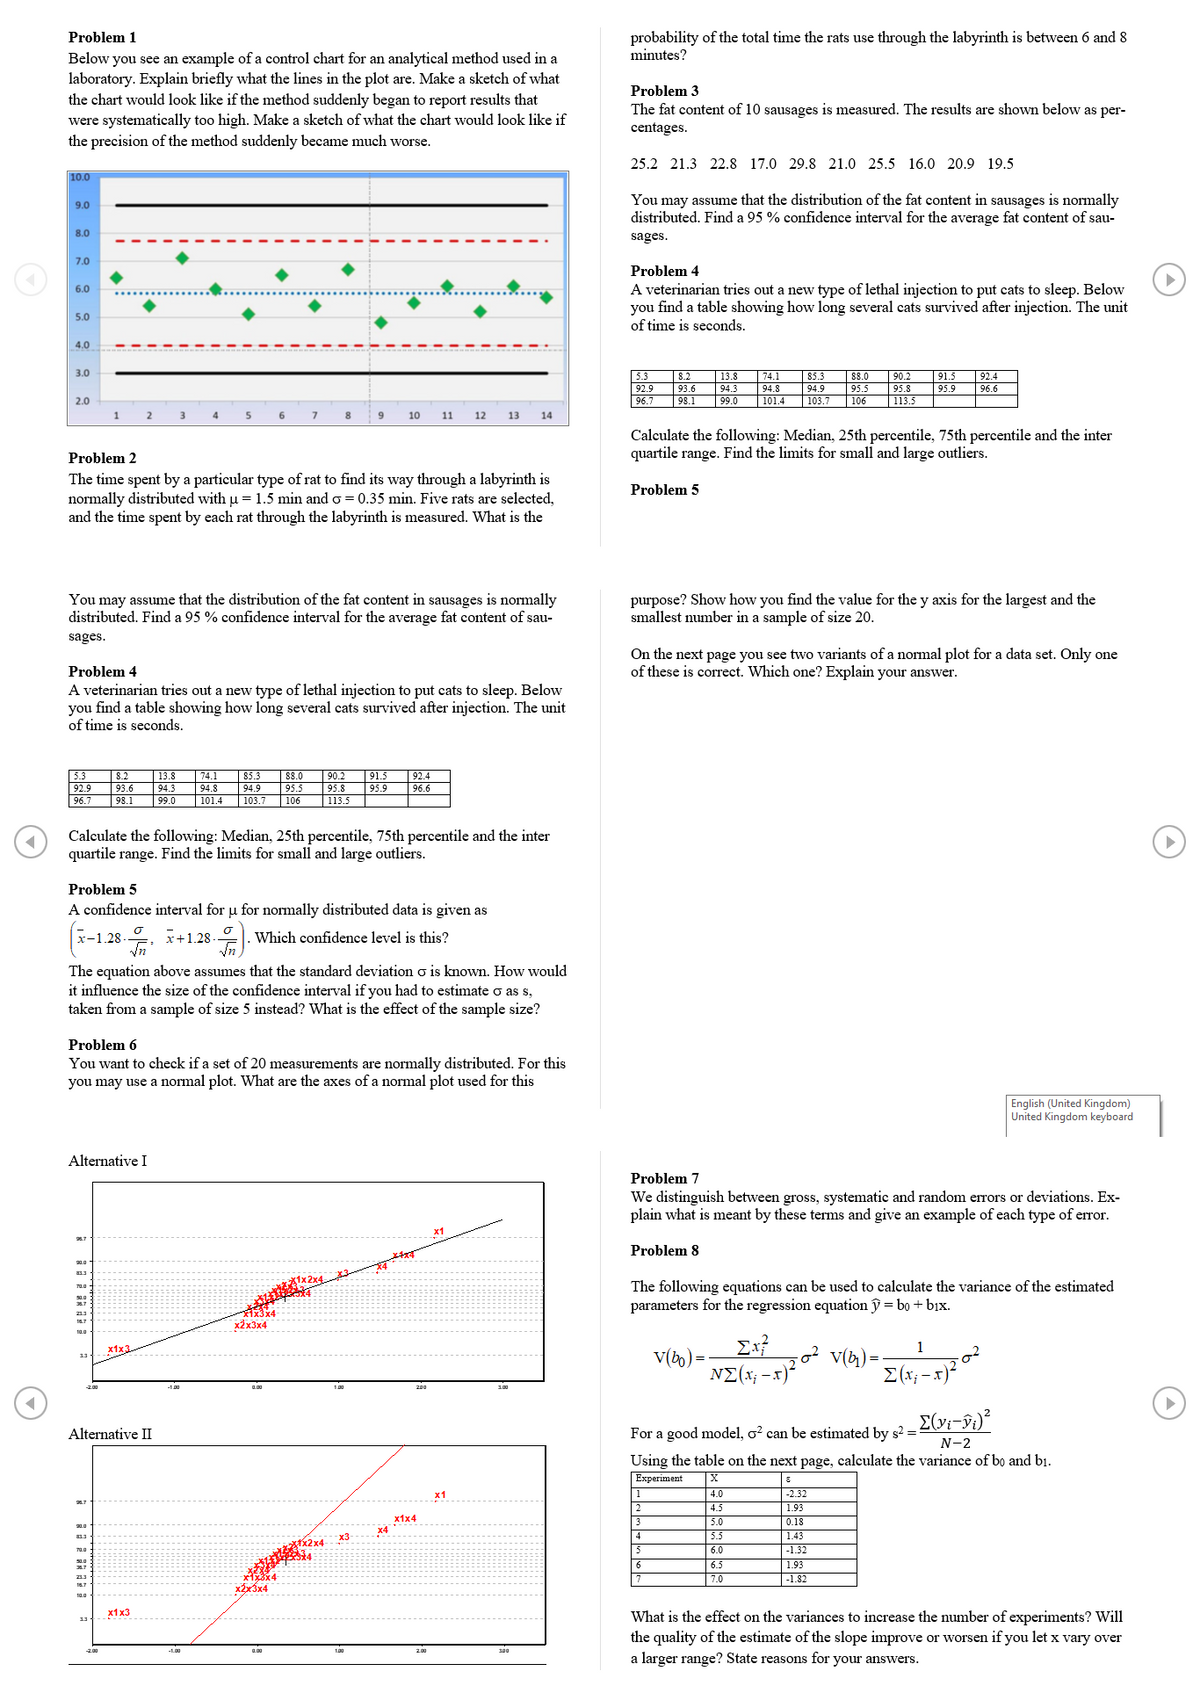
Below you see an example of a control chart for an analytical method used in a
laboratory. Explain briefly what the lines in the plot are. Make a sketch of what
the chart would look like if the method suddenly began to report results that
were systematically too high. Make a sketch of what the chart would look like if
the precision of the method suddenly became much worse.
Problem 3
The fat content of 10 sausages is measured. The results are shown below as per-
centages.
25.2 21.3 22.8 17.0 29.8 21.0 25.5 16.0 20.9 19.5
10.0
You may assume that the distribution of the fat content in sausages is normally
distributed. Find a 95 % confidence interval for the average fat content of sau-
9.0
8.0
sages.
7.0
Problem 4
A veterinarian tries out a new type of lethal injection to put cats to sleep. Below
you find a table showing how long several cats survived after injection. The unit
of time is seconds.
6.0
5.0
4.0
3.0
5.3
92.9
96.7
13.8
90.2
95.8
8.2
74.1
85.3
88.0
91.5
92.4
93.6
94.3
94.8
94.9
95.5
95.9
96.6
2.0
98.1
99.0
|101.4
|103.7
|106
|113.5
4
5
8
10
11
12
13
14
Calculate the following: Median, 25th percentile, 75th percentile and the inter
quartile range. Find the limits for small and large outliers.
Problem 2
The time spent by a particular type of rat to find its way through a labyrinth is
normally distributed with u = 1.5 min and o = 0.35 min. Five rats are selected,
and the time spent by each rat through the labyrinth is measured. What is the
Problem 5
You may assume that the distribution of the fat content in sausages is normally
distributed. Find a 95 % confidence interval for the average fat content of sau-
purpose? Show how you find the value for the y axis for the largest and the
smallest number in a sample of size 20.
sages.
On the next page you see two variants of a nomal plot for a data set. Only one
of these is correct. Which one? Explain your answer.
Problem 4
A veterinarian tries out a new type of lethal injection to put cats to sleep. Below
you find a table showing how long several cats survived after injection. The unit
of time is seconds.
|13.9
94.3
|74.1
94.8
101.4
90.2
95.8
113.5
5.3
8.2
85.3
88.0
91.5
92.4
92.9
93.6
94.9
95.5
95.9
96.6
96.7
98.1
99.0
103.7
106
Calculate the following: Median, 25th percentile, 75th percentile and the inter
quartile range. Find the limits for small and large outliers.
Problem 5
A confidence interval for u for normally distributed data is given as
x-1.28-. i+1.28-
Which confidence level is this?
The equation above assumes that the standard deviation o is known. How would
it influence the size of the confidence interval if you had to estimate o as s,
taken from a sample of size 5 instead? What is the effect of the sample size?
Problem 6
You want to check if a set of 20 measurements are normally distributed. For this
you may use a normal plot. What are the axes of a normal plot used for this
English (United Kingdom)
United Kingdom keyboard
Alternative I
Problem 7
We distinguish between gross, systematic and random errors or deviations. Ex-
plain what is meant by these terms and give an example of each type of error.
x1
Problem 8
The following equations can be used to calculate the variance of the estimated
parameters for the regression equation y = bo + bjx.
文4-
x2x3x4
213
16.7
10.0
1
V(4) =
E(x; - x)-
x1x3.
V(bo) =
NE(x; -x)?
200
Alternative II
For a good model, o? can be estimated by s? =
N-2
Using the table on the next page, calculate the variance of bo and bi.
Experiment
4.0
-2.32
2
4.5
1.93
х1x4
3
5.0
0.18
x4
stx2x4
x3
4
5.5
1.43
5
6.0
-1.32
6.5
7.0
6
1.93
|-1.82
213
16.7
x2x3x4
10.0
х1x3
What is the effect on the variances to increase the number of experiments? Will
the quality of the estimate of the slope improve or worsen if you let x vary over
a larger range? State reasons for your answers.
13
-L00
200
300
Expert Solution
This question has been solved!
Explore an expertly crafted, step-by-step solution for a thorough understanding of key concepts.

Step by step
Solved in 2 steps with 2 images

Recommended textbooks for you
MATLAB: An Introduction with Applications
Statistics
ISBN:
9781119256830
Author:
Amos Gilat
Publisher:
John Wiley & Sons Inc

Probability and Statistics for Engineering and th…
Statistics
ISBN:
9781305251809
Author:
Jay L. Devore
Publisher:
Cengage Learning

Statistics for The Behavioral Sciences (MindTap C…
Statistics
ISBN:
9781305504912
Author:
Frederick J Gravetter, Larry B. Wallnau
Publisher:
Cengage Learning
MATLAB: An Introduction with Applications
Statistics
ISBN:
9781119256830
Author:
Amos Gilat
Publisher:
John Wiley & Sons Inc
Probability and Statistics for Engineering and th…
Statistics
ISBN:
9781305251809
Author:
Jay L. Devore
Publisher:
Cengage Learning
Statistics for The Behavioral Sciences (MindTap C…
Statistics
ISBN:
9781305504912
Author:
Frederick J Gravetter, Larry B. Wallnau
Publisher:
Cengage Learning

Elementary Statistics: Picturing the World (7th E…
Statistics
ISBN:
9780134683416
Author:
Ron Larson, Betsy Farber
Publisher:
PEARSON

The Basic Practice of Statistics
Statistics
ISBN:
9781319042578
Author:
David S. Moore, William I. Notz, Michael A. Fligner
Publisher:
W. H. Freeman

Introduction to the Practice of Statistics
Statistics
ISBN:
9781319013387
Author:
David S. Moore, George P. McCabe, Bruce A. Craig
Publisher:
W. H. Freeman