The time to complete the Advanced Placement (AP) Statistics Exam in previous years is normally distributed with an average time of 2.5 hours. Because of school closures due to COVID-19, the College Board offered an at-home test for the 2020 AP Statistics Exam. A teacher feels that students, on average, will have a different completion time for the at-home exam. They take a random sample of 27 students that took the exam and their mean time was 2.66 hours with a standard deviation of 0.3 hours. Test to see if the mean time has significantly changed using a 5% level of significance. Give answers to at least 4 decimal places.
The time to complete the Advanced Placement (AP) Statistics Exam in previous years is normally distributed with an average time of 2.5 hours. Because of school closures due to COVID-19, the College Board offered an at-home test for the 2020 AP Statistics Exam. A teacher feels that students, on average, will have a different completion time for the at-home exam. They take a random sample of 27 students that took the exam and their mean time was 2.66 hours with a standard deviation of 0.3 hours. Test to see if the mean time has significantly changed using a 5% level of significance. Give answers to at least 4 decimal places.

MATLAB: An Introduction with Applications
6th Edition
ISBN:9781119256830
Author:Amos Gilat
Publisher:Amos Gilat
Chapter1: Starting With Matlab
Section: Chapter Questions
Problem 1P

Related questions
Question
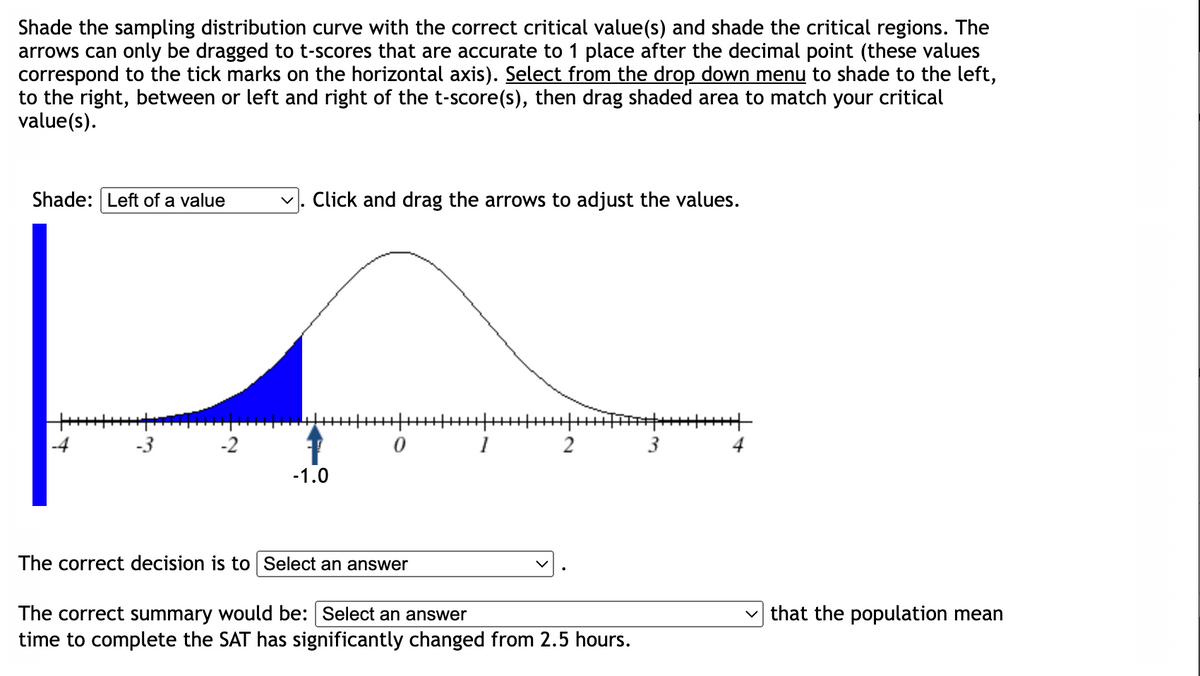
Transcribed Image Text:Shade the sampling distribution curve with the correct critical value(s) and shade the critical regions. The
arrows can only be dragged to t-scores that are accurate to 1 place after the decimal point (these values
correspond to the tick marks on the horizontal axis). Select from the drop down menu to shade to the left,
to the right, between or left and right of the t-score(s), then drag shaded area to match your critical
value(s).
Shade: Left of a value
-2
Click and drag the arrows to adjust the values.
-1.0
0
1
2
The correct decision is to Select an answer
The correct summary would be: Select an answer
time to complete the SAT has significantly changed from 2.5 hours.
3
+++++
that the population mean
![The time to complete the Advanced Placement (AP) Statistics Exam in previous years is normally
distributed with an average time of 2.5 hours. Because of school closures due to COVID-19, the College
Board offered an at-home test for the 2020 AP Statistics Exam. A teacher feels that students, on average,
will have a different completion time for the at-home exam. They take a random sample of 27 students
that took the exam and their mean time was 2.66 hours with a standard deviation of 0.3 hours. Test to see
if the mean time has significantly changed using a 5% level of significance. Give answers to at least 4
decimal places.
What are the correct hypotheses?
Ho: Select an answer ✓
H₁: Select an answer ✓ ? ✓
?
Test Statistic t =
Based on the hypotheses, find the following:
Critical-Value t ±
hours
Enter an integer or decimal number [more..]
hours](/v2/_next/image?url=https%3A%2F%2Fcontent.bartleby.com%2Fqna-images%2Fquestion%2F88c4a12b-1ea9-44c1-9400-53c8c9c9bde6%2F3a780764-e249-4763-ae78-4e2e26395c2d%2Fdbgnbx_processed.png&w=3840&q=75)
Transcribed Image Text:The time to complete the Advanced Placement (AP) Statistics Exam in previous years is normally
distributed with an average time of 2.5 hours. Because of school closures due to COVID-19, the College
Board offered an at-home test for the 2020 AP Statistics Exam. A teacher feels that students, on average,
will have a different completion time for the at-home exam. They take a random sample of 27 students
that took the exam and their mean time was 2.66 hours with a standard deviation of 0.3 hours. Test to see
if the mean time has significantly changed using a 5% level of significance. Give answers to at least 4
decimal places.
What are the correct hypotheses?
Ho: Select an answer ✓
H₁: Select an answer ✓ ? ✓
?
Test Statistic t =
Based on the hypotheses, find the following:
Critical-Value t ±
hours
Enter an integer or decimal number [more..]
hours
Expert Solution
This question has been solved!
Explore an expertly crafted, step-by-step solution for a thorough understanding of key concepts.

Step by step
Solved in 8 steps with 3 images

Recommended textbooks for you
MATLAB: An Introduction with Applications
Statistics
ISBN:
9781119256830
Author:
Amos Gilat
Publisher:
John Wiley & Sons Inc

Probability and Statistics for Engineering and th…
Statistics
ISBN:
9781305251809
Author:
Jay L. Devore
Publisher:
Cengage Learning

Statistics for The Behavioral Sciences (MindTap C…
Statistics
ISBN:
9781305504912
Author:
Frederick J Gravetter, Larry B. Wallnau
Publisher:
Cengage Learning
MATLAB: An Introduction with Applications
Statistics
ISBN:
9781119256830
Author:
Amos Gilat
Publisher:
John Wiley & Sons Inc
Probability and Statistics for Engineering and th…
Statistics
ISBN:
9781305251809
Author:
Jay L. Devore
Publisher:
Cengage Learning
Statistics for The Behavioral Sciences (MindTap C…
Statistics
ISBN:
9781305504912
Author:
Frederick J Gravetter, Larry B. Wallnau
Publisher:
Cengage Learning

Elementary Statistics: Picturing the World (7th E…
Statistics
ISBN:
9780134683416
Author:
Ron Larson, Betsy Farber
Publisher:
PEARSON

The Basic Practice of Statistics
Statistics
ISBN:
9781319042578
Author:
David S. Moore, William I. Notz, Michael A. Fligner
Publisher:
W. H. Freeman

Introduction to the Practice of Statistics
Statistics
ISBN:
9781319013387
Author:
David S. Moore, George P. McCabe, Bruce A. Craig
Publisher:
W. H. Freeman