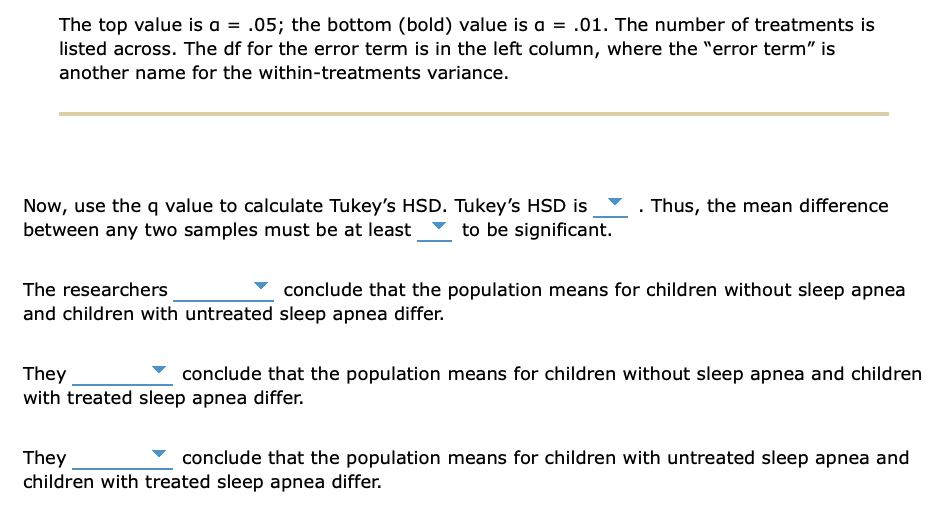
The top value is a = .05; the bottom (bold) value is a = .01. The number of treatments is listed across. The df for the error term is in the left column, where the "error term" is another name for the within-treatments variance. Now, use the q value to calculate Tukey's HSD. Tukey's HSD is between any two samples must be at least to be significant. . Thus, the mean difference The researchers conclude that the population means for children without sleep apnea and children with untreated sleep apnea differ. They conclude that the population means for children without sleep apnea and children with treated sleep apnea differ. They conclude that the population means for children with untreated sleep apnea and children with treated sleep apnea differ.
The top value is a = .05; the bottom (bold) value is a = .01. The number of treatments is listed across. The df for the error term is in the left column, where the "error term" is another name for the within-treatments variance. Now, use the q value to calculate Tukey's HSD. Tukey's HSD is between any two samples must be at least to be significant. . Thus, the mean difference The researchers conclude that the population means for children without sleep apnea and children with untreated sleep apnea differ. They conclude that the population means for children without sleep apnea and children with treated sleep apnea differ. They conclude that the population means for children with untreated sleep apnea and children with treated sleep apnea differ.

Linear Algebra: A Modern Introduction
4th Edition
ISBN:9781285463247
Author:David Poole
Publisher:David Poole
Chapter4: Eigenvalues And Eigenvectors
Section4.6: Applications And The Perron-frobenius Theorem
Problem 25EQ

Related questions
Question
Problem #10
Transcribed Image Text:The top value is a = .05; the bottom (bold) value is a = .01. The number of treatments is
listed across. The df for the error term is in the left column, where the "error term" is
another name for the within-treatments variance.
Now, use the q value to calculate Tukey's HSD. Tukey's HSD is
between any two samples must be at least
to be significant.
Thus, the mean difference
The researchers
conclude that the population means for children without sleep apnea
and children with untreated sleep apnea differ.
They
conclude that the population means for children without sleep apnea and children
with treated sleep apnea differ.
They
conclude that the population means for children with untreated sleep apnea and
children with treated sleep apnea differ.
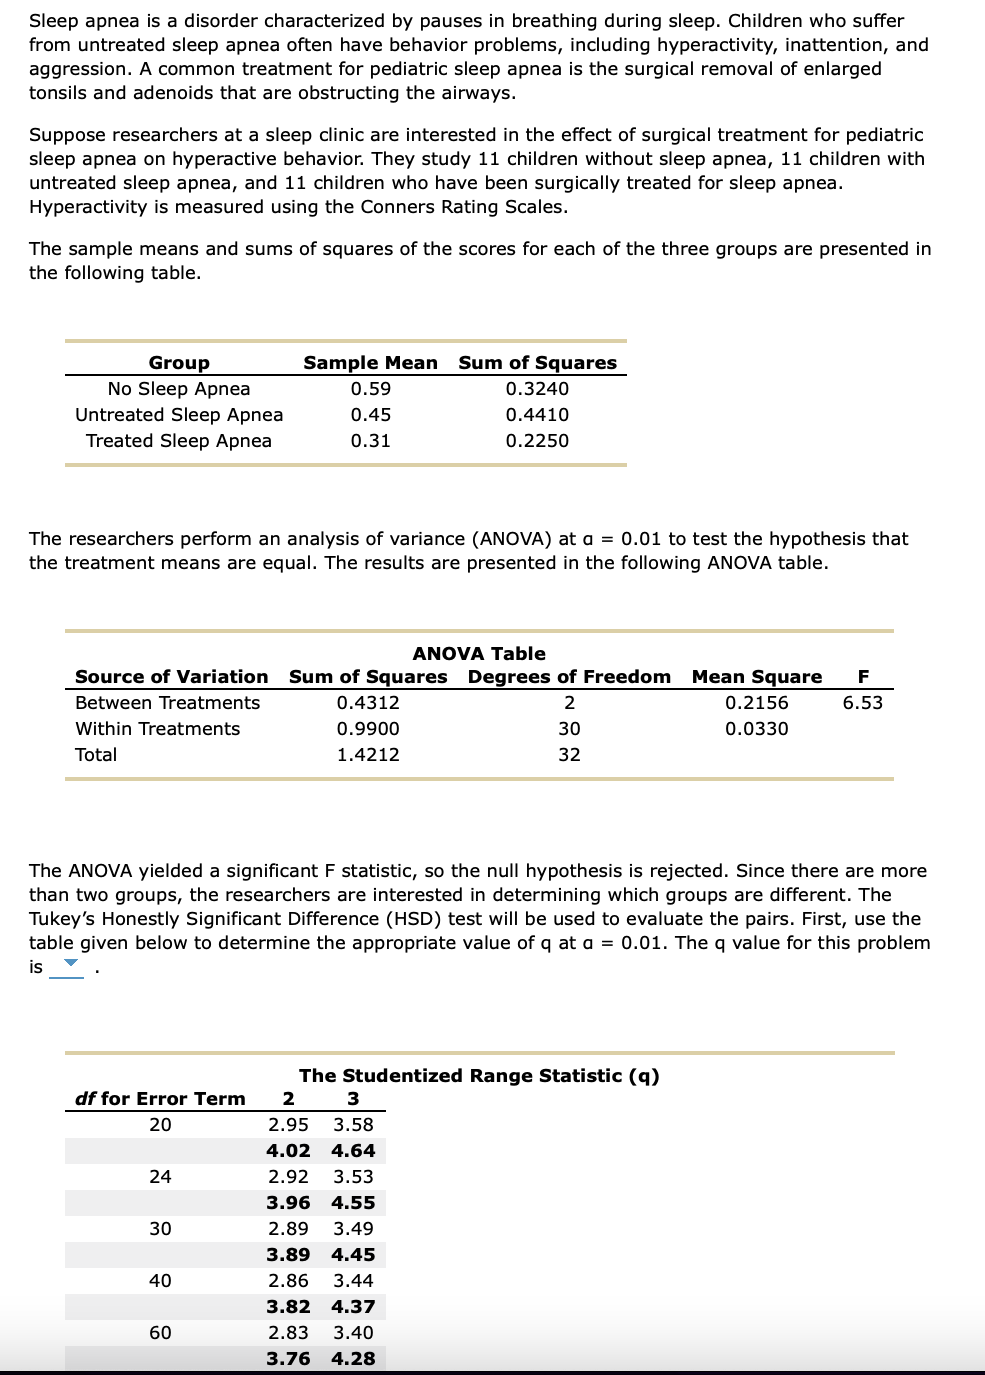
Transcribed Image Text:Sleep apnea is a disorder characterized by pauses in breathing during sleep. Children who suffer
from untreated sleep apnea often have behavior problems, including hyperactivity, inattention, and
aggression. A common treatment for pediatric sleep apnea is the surgical removal of enlarged
tonsils and adenoids that are obstructing the airways.
Suppose researchers at a sleep clinic are interested in the effect of surgical treatment for pediatric
sleep apnea on hyperactive behavior. They study 11 children without sleep apnea, 11 children with
untreated sleep apnea, and 11 children who have been surgically treated for sleep apnea.
Hyperactivity is measured using the Conners Rating Scales.
The sample means and sums of squares of the scores for each of the three groups are presented in
the following table.
Group
No Sleep Apnea
Untreated Sleep Apnea
Treated Sleep Apnea
The researchers perform an analysis of variance (ANOVA) at a = 0.01 to test the hypothesis that
the treatment means are equal. The results are presented in the following ANOVA table.
ANOVA Table
Source of Variation Sum of Squares Degrees of Freedom Mean Square F
Between Treatments
2
6.53
Within Treatments
30
Total
32
df for Error Term
20
24
Sample Mean Sum of Squares
0.3240
0.4410
0.2250
30
0.59
0.45
0.31
The ANOVA yielded a significant F statistic, so the null hypothesis is rejected. Since there are more
than two groups, the researchers are interested in determining which groups are different. The
Tukey's Honestly Significant Difference (HSD) test will be used to evaluate the pairs. First, use the
table given below to determine the appropriate value of q at a = 0.01. The q value for this problem
is
40
60
0.4312
0.9900
1.4212
0.2156
0.0330
The Studentized Range Statistic (q)
2
2.95 3.58
3
4.02 4.64
2.92 3.53
3.96 4.55
2.89 3.49
3.89 4.45
2.86 3.44
3.82 4.37
2.83 3.40
3.76 4.28
Expert Solution
This question has been solved!
Explore an expertly crafted, step-by-step solution for a thorough understanding of key concepts.

This is a popular solution!

Trending now
This is a popular solution!

Step by step
Solved in 3 steps

Recommended textbooks for you
Linear Algebra: A Modern Introduction
Algebra
ISBN:
9781285463247
Author:
David Poole
Publisher:
Cengage Learning

Algebra & Trigonometry with Analytic Geometry
Algebra
ISBN:
9781133382119
Author:
Swokowski
Publisher:
Cengage

Trigonometry (MindTap Course List)
Trigonometry
ISBN:
9781337278461
Author:
Ron Larson
Publisher:
Cengage Learning
Linear Algebra: A Modern Introduction
Algebra
ISBN:
9781285463247
Author:
David Poole
Publisher:
Cengage Learning
Algebra & Trigonometry with Analytic Geometry
Algebra
ISBN:
9781133382119
Author:
Swokowski
Publisher:
Cengage
Trigonometry (MindTap Course List)
Trigonometry
ISBN:
9781337278461
Author:
Ron Larson
Publisher:
Cengage Learning