The US vehicle sticker information states that you can expect 19 miles per gallon. It is desired to check the consistency of this information. Sixteen vehicles of the same model were tested. Assuming the miles per gallon X-N (μ, 0²) and we take a random sample of n=16. What is the p-value when testing = 19 Hop: H : μ # 19 We observe = 18. 16 and s-1.48 where s is the sample standard deviation. 0.038 1 0.019 0.037
The US vehicle sticker information states that you can expect 19 miles per gallon. It is desired to check the consistency of this information. Sixteen vehicles of the same model were tested. Assuming the miles per gallon X-N (μ, 0²) and we take a random sample of n=16. What is the p-value when testing = 19 Hop: H : μ # 19 We observe = 18. 16 and s-1.48 where s is the sample standard deviation. 0.038 1 0.019 0.037

MATLAB: An Introduction with Applications
6th Edition
ISBN:9781119256830
Author:Amos Gilat
Publisher:Amos Gilat
Chapter1: Starting With Matlab
Section: Chapter Questions
Problem 1P

Related questions
Question
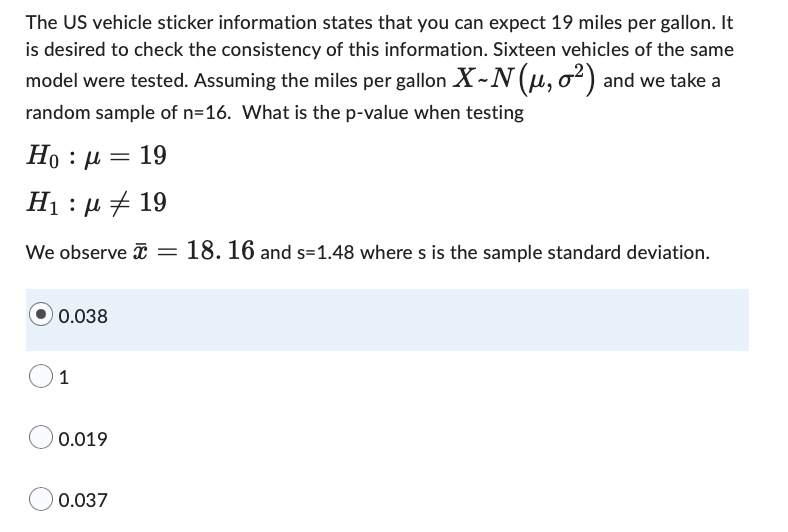
Transcribed Image Text:The US vehicle sticker information states that you can expect 19 miles per gallon. It
is desired to check the consistency of this information. Sixteen vehicles of the same
model were tested. Assuming the miles per gallon X-N (μ, o²) and we take a
random sample of n=16. What is the p-value when testing
Ho : |= 19
Η : μ # 19
We observe = 18. 16 and s-1.48 where s is the sample standard deviation.
0.038
1
0.019
0.037
Expert Solution
This question has been solved!
Explore an expertly crafted, step-by-step solution for a thorough understanding of key concepts.

Step by step
Solved in 2 steps

Recommended textbooks for you
MATLAB: An Introduction with Applications
Statistics
ISBN:
9781119256830
Author:
Amos Gilat
Publisher:
John Wiley & Sons Inc

Probability and Statistics for Engineering and th…
Statistics
ISBN:
9781305251809
Author:
Jay L. Devore
Publisher:
Cengage Learning

Statistics for The Behavioral Sciences (MindTap C…
Statistics
ISBN:
9781305504912
Author:
Frederick J Gravetter, Larry B. Wallnau
Publisher:
Cengage Learning
MATLAB: An Introduction with Applications
Statistics
ISBN:
9781119256830
Author:
Amos Gilat
Publisher:
John Wiley & Sons Inc
Probability and Statistics for Engineering and th…
Statistics
ISBN:
9781305251809
Author:
Jay L. Devore
Publisher:
Cengage Learning
Statistics for The Behavioral Sciences (MindTap C…
Statistics
ISBN:
9781305504912
Author:
Frederick J Gravetter, Larry B. Wallnau
Publisher:
Cengage Learning

Elementary Statistics: Picturing the World (7th E…
Statistics
ISBN:
9780134683416
Author:
Ron Larson, Betsy Farber
Publisher:
PEARSON

The Basic Practice of Statistics
Statistics
ISBN:
9781319042578
Author:
David S. Moore, William I. Notz, Michael A. Fligner
Publisher:
W. H. Freeman

Introduction to the Practice of Statistics
Statistics
ISBN:
9781319013387
Author:
David S. Moore, George P. McCabe, Bruce A. Craig
Publisher:
W. H. Freeman