The velocity of a package traveling along the axis is shown as a function of time in the figure below. If the package is at x = 0 when t= 0, answer the following. Vx (m/s) 20 10 t (s) -10 (a) What is the object's acceleration (in m/s2) between 0 and 4.00 s? (Indicate the direction with the sign of your answer.) V m/s2 (b) What is the object's acceleration (in m/s2) between 4.00 s and 9.00 s? (Indicate the direction with the sign of your answer.) 6 From the plot, we see that the velocity is changing at a constant rate during the time interval of interest. The acceleration is the slope of the straight line between times of interest. m/s? (c) What is the object's acceleration (in m/s2) between 12.0 s and 18.0 s? (Indicate the direction with the sign of your answer.) 3 The acceleration during the time interval of interest may be determined by finding the slope of the velocity-versus-time plot during this time. Looking at the graph, what is the slope of this line? m/s?
The velocity of a package traveling along the axis is shown as a function of time in the figure below. If the package is at x = 0 when t= 0, answer the following. Vx (m/s) 20 10 t (s) -10 (a) What is the object's acceleration (in m/s2) between 0 and 4.00 s? (Indicate the direction with the sign of your answer.) V m/s2 (b) What is the object's acceleration (in m/s2) between 4.00 s and 9.00 s? (Indicate the direction with the sign of your answer.) 6 From the plot, we see that the velocity is changing at a constant rate during the time interval of interest. The acceleration is the slope of the straight line between times of interest. m/s? (c) What is the object's acceleration (in m/s2) between 12.0 s and 18.0 s? (Indicate the direction with the sign of your answer.) 3 The acceleration during the time interval of interest may be determined by finding the slope of the velocity-versus-time plot during this time. Looking at the graph, what is the slope of this line? m/s?

An Introduction to Physical Science
14th Edition
ISBN:9781305079137
Author:James Shipman, Jerry D. Wilson, Charles A. Higgins, Omar Torres
Publisher:James Shipman, Jerry D. Wilson, Charles A. Higgins, Omar Torres
Chapter2: Motion
Section: Chapter Questions
Problem LM

Related questions

Question
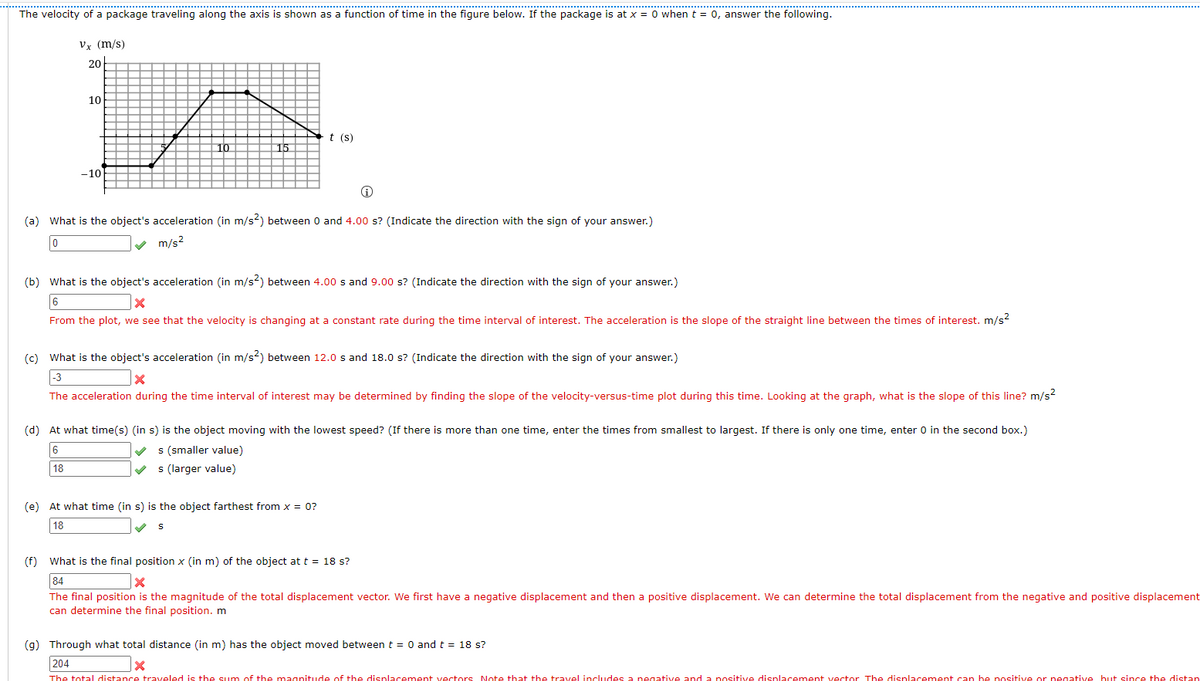
Transcribed Image Text:The velocity of a package traveling along the axis is shown as a function of time in the figure below. If the package is at x = 0 when t = 0, answer the following.
Vx (m/s)
20
10
t (s)
10
15
-10
(a) What is the object's acceleration (in m/s2) between 0 and 4.00 s? (Indicate the direction with the sign of your answer.)
v m/s2
(b) What is the object's acceleration (in m/s?) between 4.00 s and 9.00 s? (Indicate the direction with the sign of your answer.)
6
From the plot, we see that the velocity is changing at a constant rate during the time interval of interest. The acceleration is the slope of the straight line between the times of interest. m/s
(c) What is the object's acceleration (in m/s?) between 12.0 s and 18.0 s? (Indicate the
with
sign of your answer.)
|-3
The acceleration during the time interval of interest may be determined by finding the slope of the velocity-versus-time plot during this time. Looking at the graph, what is the slope of this line? m/s?
(d) At what time(s) (in s) is the object moving with the lowest speed? (If there is more than one time, enter the times from smallest to largest. If there is only one time, enter 0 in the second box.)
v s (smaller value)
s (larger value)
6
18
(e) At what time (in s) is the object farthest from x = 0?
18
(f) What is the final position x (in m) of the object at t = 18 s?
84
The final position is the magnitude of the total displacement vector. We first have a negative displacement and then a positive displacement. We can determine the total displacement from the negative and positive displacement
can determine the final position. m
(g) Through what total distance (in m) has the object moved between t = 0 and t = 18 s?
204
The total distance traveled is the sum of the magnitude of the displacement vectors Note that the travel includes a negative and a positive displacement vector The disnlacement can be positive or negative but since the distan
Expert Solution
This question has been solved!
Explore an expertly crafted, step-by-step solution for a thorough understanding of key concepts.

This is a popular solution!

Trending now
This is a popular solution!

Step by step
Solved in 2 steps

Knowledge Booster


Learn more about
Need a deep-dive on the concept behind this application? Look no further. Learn more about this topic, physics and related others by exploring similar questions and additional content below.Recommended textbooks for you
An Introduction to Physical Science
Physics
ISBN:
9781305079137
Author:
James Shipman, Jerry D. Wilson, Charles A. Higgins, Omar Torres
Publisher:
Cengage Learning

University Physics Volume 1
Physics
ISBN:
9781938168277
Author:
William Moebs, Samuel J. Ling, Jeff Sanny
Publisher:
OpenStax - Rice University
An Introduction to Physical Science
Physics
ISBN:
9781305079137
Author:
James Shipman, Jerry D. Wilson, Charles A. Higgins, Omar Torres
Publisher:
Cengage Learning
University Physics Volume 1
Physics
ISBN:
9781938168277
Author:
William Moebs, Samuel J. Ling, Jeff Sanny
Publisher:
OpenStax - Rice University