The water and sewage service company of a city in the country selected 120 clients, at random, who use this service. In the last month, the value of these invoices, in thousands of $, is reported in the following frequency distribution. The calculated average value of customer invoices is: Note: Answer with at least 4 decimal places x¯= Answer
The water and sewage service company of a city in the country selected 120 clients, at random, who use this service. In the last month, the value of these invoices, in thousands of $, is reported in the following frequency distribution. The calculated average value of customer invoices is: Note: Answer with at least 4 decimal places x¯= Answer

MATLAB: An Introduction with Applications
6th Edition
ISBN:9781119256830
Author:Amos Gilat
Publisher:Amos Gilat
Chapter1: Starting With Matlab
Section: Chapter Questions
Problem 1P

Related questions
Question
The water and sewage service company of a city in the country selected 120 clients, at random, who use this service. In the last month, the value of these invoices, in thousands of $, is reported in the following frequency distribution.
The calculated average value of customer invoices is:
Note: Answer with at least 4 decimal places
x¯= Answer
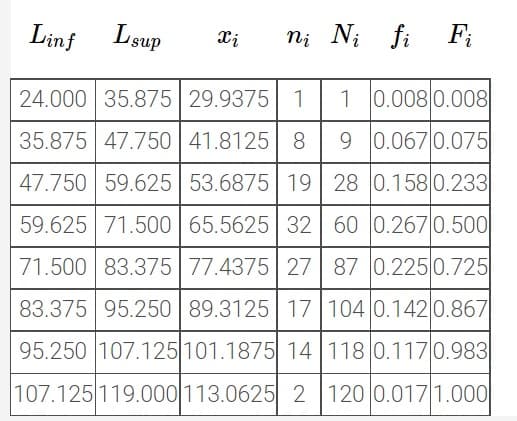
Transcribed Image Text:Linf Lsup
ni Ni fi
Xi
24.000 35.875 29.9375 1
1 0.008 0.008
35.875 47.750 41.8125 8
9 0.067 0.075
47.750 59.625 53.6875 19 28 0.158 0.233
59.625 71.500 65.5625 32 60 0.2670.500
71.500 83.375 77.4375 27 87 0.225 0.725
83.375 95.250 89.3125 17 104 0.142 0.867
95.250 107.125 101.1875 14 118 0.117 0.983
107.125119.000113.0625 2 120 0.017 1.000
Expert Solution
This question has been solved!
Explore an expertly crafted, step-by-step solution for a thorough understanding of key concepts.

Step by step
Solved in 2 steps with 2 images

Recommended textbooks for you
MATLAB: An Introduction with Applications
Statistics
ISBN:
9781119256830
Author:
Amos Gilat
Publisher:
John Wiley & Sons Inc

Probability and Statistics for Engineering and th…
Statistics
ISBN:
9781305251809
Author:
Jay L. Devore
Publisher:
Cengage Learning

Statistics for The Behavioral Sciences (MindTap C…
Statistics
ISBN:
9781305504912
Author:
Frederick J Gravetter, Larry B. Wallnau
Publisher:
Cengage Learning
MATLAB: An Introduction with Applications
Statistics
ISBN:
9781119256830
Author:
Amos Gilat
Publisher:
John Wiley & Sons Inc
Probability and Statistics for Engineering and th…
Statistics
ISBN:
9781305251809
Author:
Jay L. Devore
Publisher:
Cengage Learning
Statistics for The Behavioral Sciences (MindTap C…
Statistics
ISBN:
9781305504912
Author:
Frederick J Gravetter, Larry B. Wallnau
Publisher:
Cengage Learning

Elementary Statistics: Picturing the World (7th E…
Statistics
ISBN:
9780134683416
Author:
Ron Larson, Betsy Farber
Publisher:
PEARSON

The Basic Practice of Statistics
Statistics
ISBN:
9781319042578
Author:
David S. Moore, William I. Notz, Michael A. Fligner
Publisher:
W. H. Freeman

Introduction to the Practice of Statistics
Statistics
ISBN:
9781319013387
Author:
David S. Moore, George P. McCabe, Bruce A. Craig
Publisher:
W. H. Freeman