The weights (in pounds) of 6 vehicles and the variability of their braking distances (in feet) when stopping on a dry surface are shown in the table. Can you conclude that there is a significant linear correlation between vehicle weight and variability in braking distance on a dry surface? Use a = 0.05. Weight, x Variability in braking distance, y E Click here to view a table of critical values for Student's t-distribution. 5920 5320 6500 5100 5880 4800 1.75 1.96 1.88 1.64 1.61 1.50 ...... Setup the hypothesis for the test. Ho: p = 0 Ha:p # 0 Identify the critical value(s). Select the correct choice below and fill in any answer boxes within your choice. (Round to three decimal places as needed.) A. The critical values are -to = - 2.776 and to = 2.776. B. The critical value is Calculate the test statistic. (Round to three decimal places as needed.)
The weights (in pounds) of 6 vehicles and the variability of their braking distances (in feet) when stopping on a dry surface are shown in the table. Can you conclude that there is a significant linear correlation between vehicle weight and variability in braking distance on a dry surface? Use a = 0.05. Weight, x Variability in braking distance, y E Click here to view a table of critical values for Student's t-distribution. 5920 5320 6500 5100 5880 4800 1.75 1.96 1.88 1.64 1.61 1.50 ...... Setup the hypothesis for the test. Ho: p = 0 Ha:p # 0 Identify the critical value(s). Select the correct choice below and fill in any answer boxes within your choice. (Round to three decimal places as needed.) A. The critical values are -to = - 2.776 and to = 2.776. B. The critical value is Calculate the test statistic. (Round to three decimal places as needed.)

Glencoe Algebra 1, Student Edition, 9780079039897, 0079039898, 2018
18th Edition
ISBN:9780079039897
Author:Carter
Publisher:Carter
Chapter4: Equations Of Linear Functions
Section4.5: Correlation And Causation
Problem 11PPS

Related questions

Topic Video
Question
Can you please check my work
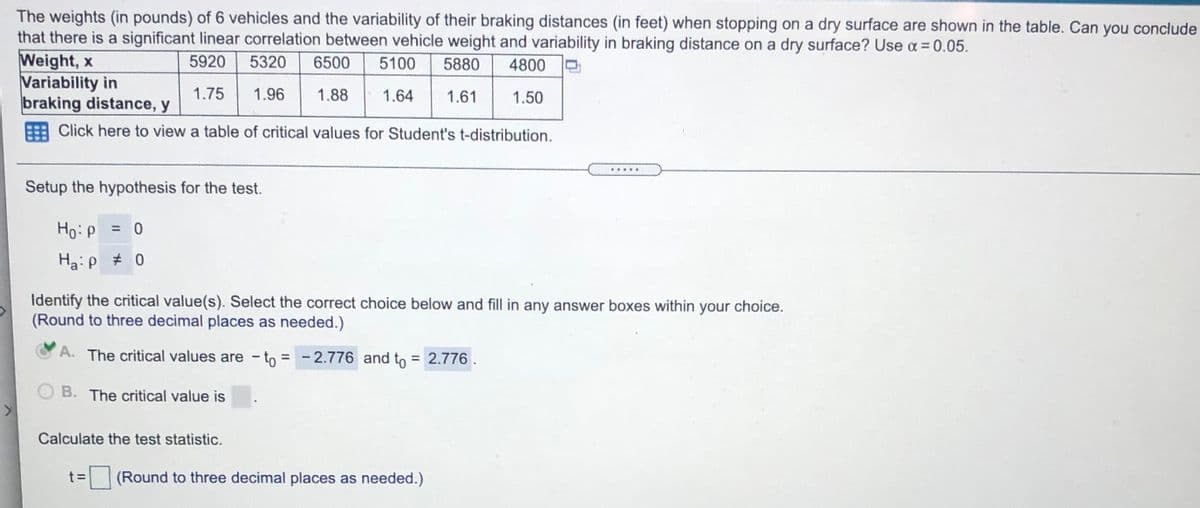
Transcribed Image Text:The weights (in pounds) of 6 vehicles and the variability of their braking distances (in feet) when stopping on a dry surface are shown in the table. Can you conclude
that there is a significant linear correlation between vehicle weight and variability in braking distance on a dry surface? Use a = 0.05.
Weight, x
Variability in
braking distance, y
5920
5320
6500
5100
5880
4800
1.75
1.96
1.88
1.64
1.61
1.50
Click here to view a table of critical values for Student's t-distribution.
Setup the hypothesis for the test.
Ho:P
=
Ha:p # 0
Identify the critical value(s). Select the correct choice below and fill in any answer boxes within your choice.
(Round to three decimal places as needed.)
A. The critical values are -to = - 2.776 and to = 2.776.
%3D
O B. The critical value is
Calculate the test statistic.
t 3=
(Round to three decimal places as needed.)
Expert Solution
This question has been solved!
Explore an expertly crafted, step-by-step solution for a thorough understanding of key concepts.

This is a popular solution!

Trending now
This is a popular solution!

Step by step
Solved in 2 steps with 2 images

Knowledge Booster


Learn more about
Need a deep-dive on the concept behind this application? Look no further. Learn more about this topic, statistics and related others by exploring similar questions and additional content below.Recommended textbooks for you
Glencoe Algebra 1, Student Edition, 9780079039897…
Algebra
ISBN:
9780079039897
Author:
Carter
Publisher:
McGraw Hill

Big Ideas Math A Bridge To Success Algebra 1: Stu…
Algebra
ISBN:
9781680331141
Author:
HOUGHTON MIFFLIN HARCOURT
Publisher:
Houghton Mifflin Harcourt
Glencoe Algebra 1, Student Edition, 9780079039897…
Algebra
ISBN:
9780079039897
Author:
Carter
Publisher:
McGraw Hill
Big Ideas Math A Bridge To Success Algebra 1: Stu…
Algebra
ISBN:
9781680331141
Author:
HOUGHTON MIFFLIN HARCOURT
Publisher:
Houghton Mifflin Harcourt