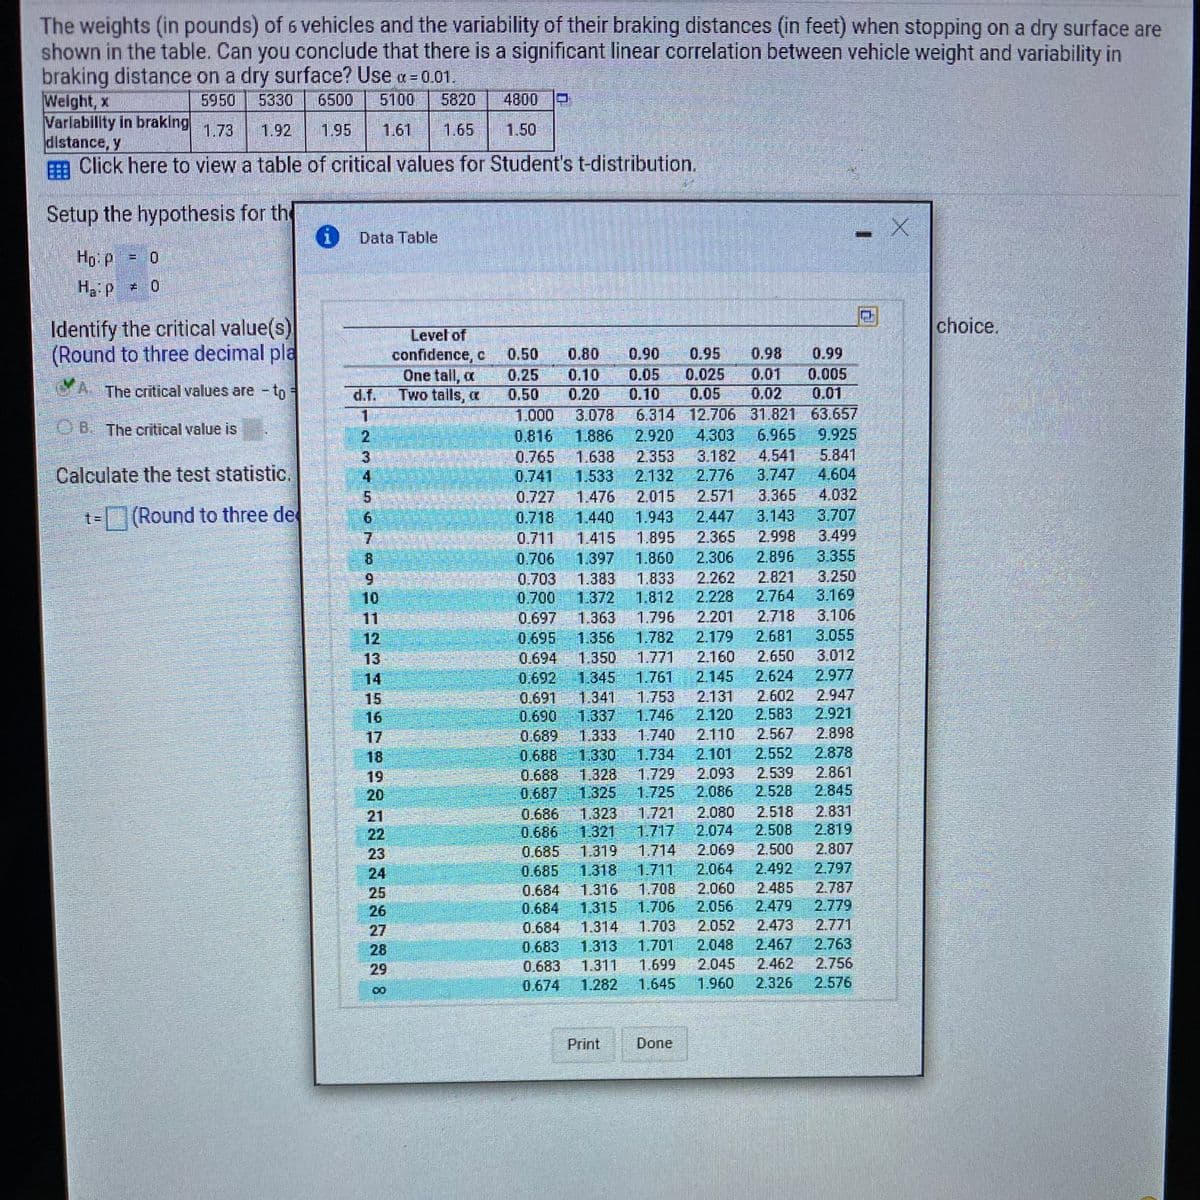
The weights (in pounds) of 6 vehicles and the variability of their braking distances (in feet) when stopping on a dry surface are shown in the table. Can you conclude that there is a significant linear correlation between vehicle weight and variability in braking distance on a dry surface? Use a = 0.01. Weight, x Variability in braking distance, y m Click here to view a table of critical values for Student's t-distribution. 5950 5330 6500 5100 5820 4800 D 1.73 1.92 1.95 1.61 1.65 1.50 Setup the hypothesis for th Data Table Ho: p = 0 Ha:p 0 Identify the critical value(s) (Round to three decimal pla choice. Level of confidence, c One tall, a Two talls, a 0.50 0.80 0.90 0.95 0.98 0.99 0.05 0.005 0.025 0.05 6.314 12.706 31.821 63.657 4.303 0.25 0.50 1.000 0.01 0.02 0.10 The critical values are - to d.f. 0.20 0.10 0.01 3.078 O B. The critical value is 0.816 0.765 0.741 0.727 0.718 1.886 2.920 6.965 9.925 2.353 2.132 3.182 2.776 4.541 3.747 1.638 5.841 Calculate the test statistic, 1.533 4.604 3.365 3.143 1.476 2.015 2.571 4.032 (Round to three de 1.440 1.943 3.707 2.447 0.711 1.415 1.895 2.365 2.998 3.499 0.706 1.397 1.860 2.306 2.896 3.355 1.383 1.372 1.833 1.812 2.821 2.764 2.718 3.250 3.169 9. 2.262 0.703 0.700 10 2.228 11 0.697 1.363 1.796 2.201 3.106 3.055 3.012 12 0.695 1.356 1.782 2.179 2.681 2.650 2.624 13 0.694 1.350 1.771 2.160 2.977 1.345 1.341 1.337 2.145 0.692 0.691 0.690 0.689 14 1.761 1.753 1.746 2.131 2.120 2.947 2.921 2.602 15 16 2.583 17 1.333 1.740 2.110 2.567 2.898 2.552 2.539 2.528 18 0.688 1.330 1.734 2.101 2.878 1.328 1.325 1.729 1.725 2.093 2.086 2.861 2.845 0.688 19 20 0.687 2.080 2.074 2.518 2.508 2.831 21 22 0.686 0.686 0.685 1.323 1.321 1.319 1.721 1.717 1.714 2.819 2.500 2.492 2.485 2.479 23 2.069 2.807 24 0.685 1.318 1.711 2.064 2.797 25 26 0.684 0.684 0.684 1.316 1.315 1.708 1.706 2.060 2.056 2.787 2.779 1.703 1.701 1.699 27 1.314 2.052 2.473 2.771 2.048 2.467 2.763 0.683 0.683 0.674 28 1.313 29 1.311 2.045 2.462 2.756 1.282 1.645 1.960 2.326 2.576 00 Print Done 23456


Correlation
Correlation defines a relationship between two independent variables. It tells the degree to which variables move in relation to each other. When two sets of data are related to each other, there is a correlation between them.
Linear Correlation
A correlation is used to determine the relationships between numerical and categorical variables. In other words, it is an indicator of how things are connected to one another. The correlation analysis is the study of how variables are related.
Regression Analysis
Regression analysis is a statistical method in which it estimates the relationship between a dependent variable and one or more independent variable. In simple terms dependent variable is called as outcome variable and independent variable is called as predictors. Regression analysis is one of the methods to find the trends in data. The independent variable used in Regression analysis is named Predictor variable. It offers data of an associated dependent variable regarding a particular outcome.

Step by step
Solved in 3 steps with 5 images


