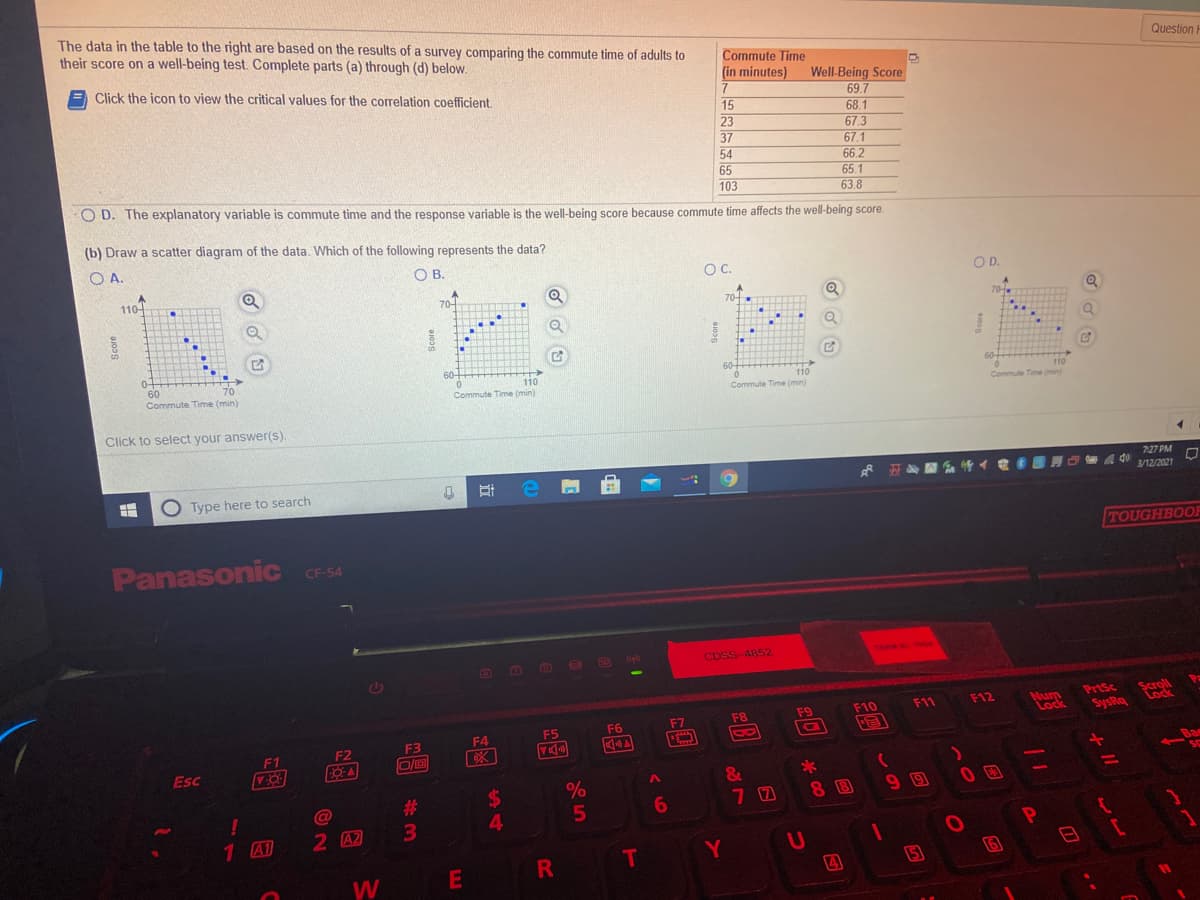
The data in the table to the right are based on the results of a survey comparing the commute time of adults to their score on a well-being test. Complete parts (a) through (d) below. Commute Time (in minutes) Well-Being Score 69.7 68.1 67.3 67.1 66.2 65.1 63.8 E Click the icon to view the critical values for the correlation coefficient. 15 23 37 54 65 103 (a) Which variable is likely the explanatory variable and which is the response variable? O A. The explanatory variable is the well-being score and the response variable is commute time because well-being score affects the commute time. O B. The explanatory variable is commute time and the response variable is the well-being score because well-being score affects the commute time score. O C. The explanatory variable is the well-being score and the response variable is commute time because commute time affects the well-being score O D. The explanatory variable is commute time and the response variable is the well-being score because commute time affects the well-being score. (b) Draw a scatter diagram of the data. Which of the following represents the data? OD. OC. OB. O A. 701. 70- E 110


Correlation
Correlation defines a relationship between two independent variables. It tells the degree to which variables move in relation to each other. When two sets of data are related to each other, there is a correlation between them.
Linear Correlation
A correlation is used to determine the relationships between numerical and categorical variables. In other words, it is an indicator of how things are connected to one another. The correlation analysis is the study of how variables are related.
Regression Analysis
Regression analysis is a statistical method in which it estimates the relationship between a dependent variable and one or more independent variable. In simple terms dependent variable is called as outcome variable and independent variable is called as predictors. Regression analysis is one of the methods to find the trends in data. The independent variable used in Regression analysis is named Predictor variable. It offers data of an associated dependent variable regarding a particular outcome.


Trending now
This is a popular solution!

Step by step
Solved in 3 steps with 2 images


