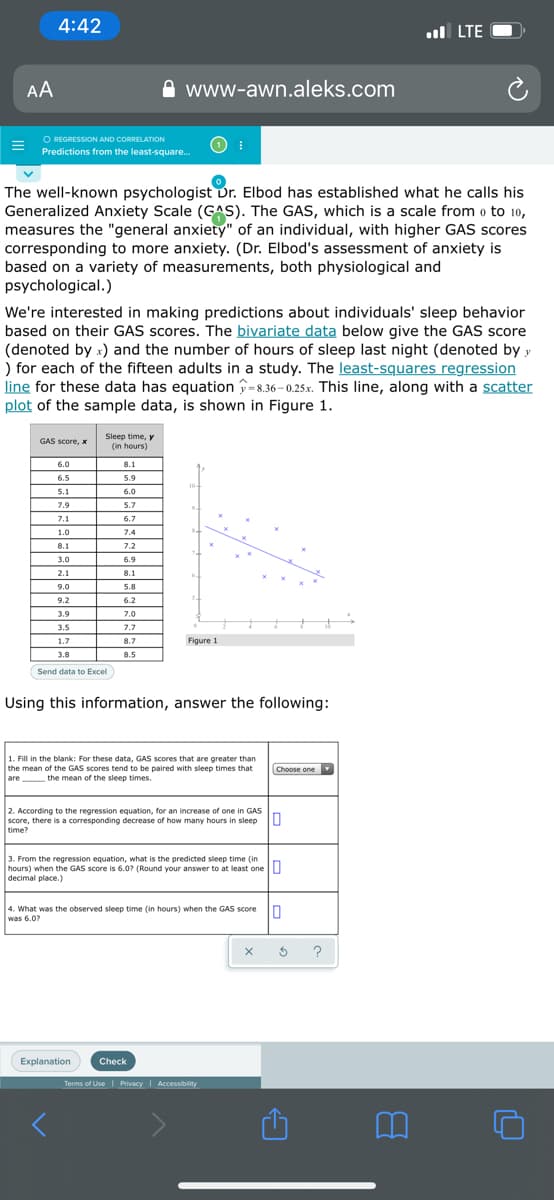
The well-known psychologist Dr. Elbod has established what he calls his Generalized Anxiety Scale (GAS). The GAS, which is a scale from o to 10, measures the "general anxiety" of an individual, with higher GAS scores corresponding to more anxiety. (Dr. Elbod's assessment of anxiety is based on a variety of measurements, both physiological and psychological.) We're interested in making predictions about individuals' sleep behavior based on their GAS scores. The bivariate data below give the GAS score (denoted by x) and the number of hours of sleep last night (denoted byy ) for each of the fifteen adults in a study. The least-squares regression line for these data has equation -8.36-0.25x. This line, along with a scatter plot of the sample data, is shown in Figure 1. Sleep time, y (in hours) GAS score, x 6.0 8.1 6.5 5.9 10 5.1 6.0 7.9 5.7 7.1 6.7 1.0 7.4 8.1 7.2 3.0 6.9 2.1 8.1 9.0 5.8 9.2 6.2 3.9 7.0 3.5 7.7 1.7 8.7 Figure 1 3.8 8.5 Send data to Excel Using this information, answer the following: 1. Fill in the blank: For these data, GAS scores that are greater than the mean of the GAS scores tend to be paired with sleep times that are Choose one the mean of the sleep times. 2. According to the regression equation, for an increase of one in GAS score, there is a corresponding decrease of how many hours in sleep U time? 3. From the regression equation, what is the predicted sleep time (in hours) when the GAS score is 6.07 (Round your answer to at least one U decimal place.) 4. What was the observed sleep time (in hours) when the GAS score was 6.07
The well-known psychologist Dr. Elbod has established what he calls his Generalized Anxiety Scale (GAS). The GAS, which is a scale from o to 10, measures the "general anxiety" of an individual, with higher GAS scores corresponding to more anxiety. (Dr. Elbod's assessment of anxiety is based on a variety of measurements, both physiological and psychological.) We're interested in making predictions about individuals' sleep behavior based on their GAS scores. The bivariate data below give the GAS score (denoted by x) and the number of hours of sleep last night (denoted byy ) for each of the fifteen adults in a study. The least-squares regression line for these data has equation -8.36-0.25x. This line, along with a scatter plot of the sample data, is shown in Figure 1. Sleep time, y (in hours) GAS score, x 6.0 8.1 6.5 5.9 10 5.1 6.0 7.9 5.7 7.1 6.7 1.0 7.4 8.1 7.2 3.0 6.9 2.1 8.1 9.0 5.8 9.2 6.2 3.9 7.0 3.5 7.7 1.7 8.7 Figure 1 3.8 8.5 Send data to Excel Using this information, answer the following: 1. Fill in the blank: For these data, GAS scores that are greater than the mean of the GAS scores tend to be paired with sleep times that are Choose one the mean of the sleep times. 2. According to the regression equation, for an increase of one in GAS score, there is a corresponding decrease of how many hours in sleep U time? 3. From the regression equation, what is the predicted sleep time (in hours) when the GAS score is 6.07 (Round your answer to at least one U decimal place.) 4. What was the observed sleep time (in hours) when the GAS score was 6.07

College Algebra
7th Edition
ISBN:9781305115545
Author:James Stewart, Lothar Redlin, Saleem Watson
Publisher:James Stewart, Lothar Redlin, Saleem Watson
Chapter1: Equations And Graphs
Section: Chapter Questions
Problem 10T: Olympic Pole Vault The graph in Figure 7 indicates that in recent years the winning Olympic men’s...

Related questions

Question
Practice Pack
Transcribed Image Text:4:42
ul LTE
AA
www-awn.aleks.com
O REGRESSION AND CORRELATION
Predictions from the least-square.
The well-known psychologist Dr. Elbod has established what he calls his
Generalized Anxiety Scale (GAS). The GAS, which is a scale from o to 10,
measures the "general anxiety" of an individual, with higher GAS scores
corresponding to more anxiety. (Dr. Elbod's assessment of anxiety is
based on a variety of measurements, both physiological and
psychological.)
We're interested in making predictions about individuals' sleep behavior
based on their GAS scores. The bivariate data below give the GAS score
(denoted by x) and the number of hours of sleep last night (denoted by y
) for each of the fifteen adults in a study. The least-squares regression
line for these data has equation =8.36-0.25x. This line, along with a scatter
plot of the sample data, is shown in Figure 1.
Sleep time, y
(in hours)
GAS score, x
6.0
8.1
6.5
5.9
10-
5.1
6.0
7.9
5.7
7.1
6.7
1.0
7.4
8.1
7.2
3.0
6.9
2.1
8.1
9.0
5.8
9.2
6.2
3.9
7.0
3.5
7.7
1.7
8.7
Figure 1
3.8
8.5
Send data to Excl
Using this information, answer the following:
1. Fill in the blank: For these data, GAS scores that are greater than
the mean of the GAS scores tend to be paired with sleep times that
are
Choose one
the mean of the sleep times.
2. According to the regression equation, for an increase of one in GAS
score, there is a corresponding decrease of how many hours in sleep
time?
3. From the regression equation, what is the predicted sleep time (in
hours) when the GAS score is 6.0? (Round your answer to at least one U
decimal place.)
4. What was the observed sleep time (in hours) when the GAS score
was 6.0?
?
Explanation
Check
Terms of Use Privacy Accessibility
Transcribed Image Text:1. Fill in the blank: For these data, GAS scores that are greater than
the mean of the GAS scores tend to be paired with sleep times that
Choose one
are
the mean of the sleep times.
2. According to the regression equation, for an increase of one in GAS
score, there is a corresponding decrease of how many hours in sleep
time?
3. From the regression equation, what is the predicted sleep time (in
hours) when the GAS score is 6.0? (Round your answer to at least one
decimal place.)
4. What was the observed sleep time (in hours) when the GAS score
was 6.0?
Expert Solution
This question has been solved!
Explore an expertly crafted, step-by-step solution for a thorough understanding of key concepts.

This is a popular solution!

Includes step-by-step video

Trending now
This is a popular solution!

Learn your way
Includes step-by-step video

Step by step
Solved in 4 steps

Knowledge Booster


Learn more about
Need a deep-dive on the concept behind this application? Look no further. Learn more about this topic, statistics and related others by exploring similar questions and additional content below.Recommended textbooks for you
College Algebra
Algebra
ISBN:
9781305115545
Author:
James Stewart, Lothar Redlin, Saleem Watson
Publisher:
Cengage Learning

Linear Algebra: A Modern Introduction
Algebra
ISBN:
9781285463247
Author:
David Poole
Publisher:
Cengage Learning

Glencoe Algebra 1, Student Edition, 9780079039897…
Algebra
ISBN:
9780079039897
Author:
Carter
Publisher:
McGraw Hill
College Algebra
Algebra
ISBN:
9781305115545
Author:
James Stewart, Lothar Redlin, Saleem Watson
Publisher:
Cengage Learning
Linear Algebra: A Modern Introduction
Algebra
ISBN:
9781285463247
Author:
David Poole
Publisher:
Cengage Learning
Glencoe Algebra 1, Student Edition, 9780079039897…
Algebra
ISBN:
9780079039897
Author:
Carter
Publisher:
McGraw Hill

Big Ideas Math A Bridge To Success Algebra 1: Stu…
Algebra
ISBN:
9781680331141
Author:
HOUGHTON MIFFLIN HARCOURT
Publisher:
Houghton Mifflin Harcourt