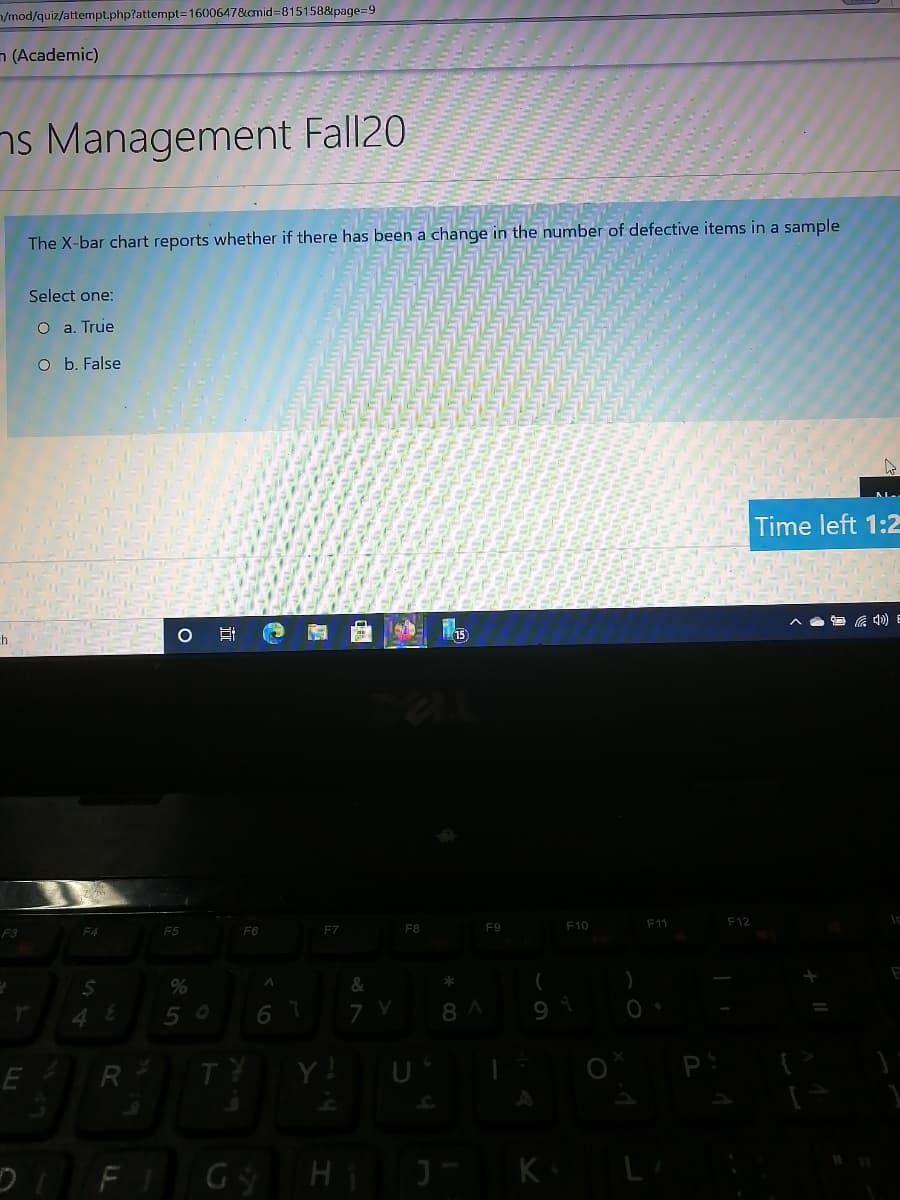
The X-bar chart reports whether if there has been a change in the number of defective items in a sample Select one: O a. True O b. False
Q: Control charts for X̅and R are maintained on the outside diameter of a shaft. The subgroup size is…
A: The detailed solution is given in Step 2.
Q: A lot 5% defective is submitted to a single sampling plan with rectifying inspection, N=500, n=120,…
A: SOLUTION: P = 5% = 0.05 N = 500 n = 120 c= 3
Q: c chart
A: Answer is C chart C charts are used to track the amount of non-conformities in a process unit based…
Q: Which of the following elements is not part of an X-bar control chart?a. The long-run center line,…
A: The X-bar control charts contains a center line (X-bar-bar), Upper Control limit, Lower Control…
Q: snip
A: The R - chart is a type of control chart that is used to monitor the variation in the existing…
Q: An airline operates a call center to handle customer questions and complaints. The airline monitors…
A: Honor code: Since you have posted a question with multiple sub-parts, we will solve the first three…
Q: The x-bar chart tests the change in the number of defective items in a given sample O a. TRUE O b.…
A: The X-bar chart is a sort of Shewhart control chart that is used to track the arithmetic means of n…
Q: Which statement(s) is true, if a sample range which is lower than the lower control limit on an…
A: The answer is as follows:
Q: Linda Boardman, Inc., an equipment manufacturer in Boston, has submitted a sample cutoff valve to…
A: Given that: μ = 12 σ = 0.070 Sigma level = 3
Q: Which statement(s) is true, if a sample range which is lower than the lower control limit on a…
A: The correct answer is (3) should be investigated because an assignable cause of variation might be…
Q: 4. A Quality Analyst wants to construct variable control chart to check if the packaging process is…
A: here, we have considered sample, for each sample , there are specific numbers of subgroups, X Bar…
Q: What fraction of product is defective for a 2.97-sigma process? Express your answer as DPMO rounded…
A: Sigma level = normsinv(1 - dpmo/1000000) + 1.5 normsinv(1 - dpmo/1000000) = Sigma level - 1.5…
Q: snip
A: Given that: Upper specification limit (USL) = 1.001 ........................no more than Lower…
Q: What are the sources of systematic error in sampling? How can systematic error be overcome? (150-175…
A: Systematic error, also known as bias, gives rise to inaccurate conclusions in sampling. Here,…
Q: Which the of the following holds the best for a point that is outside of the upper control limit on…
A: The subgroups lying outside the control limits Indicates that the process is out of control.
Q: In the past, Alpha Corporation has not performed incoming quality control inspections but has taken…
A: The value of c is 5 according to the table (excerpt from a sample plan table for α = 0.05 and β =…
Q: Vhich statement(s) is true, if a sample range which is lower than the lower control limit on an…
A: If in calculations the lower control limit is shown as negative, it is not practically possible,…
Q: A. Simple Random Sample B. Stratified Random Sample C. Cluster Random Sample D. Systematic Random…
A: A method of picking individuals or a subset of the population in order to make statistical…
Q: point on a control chart falls outside one of the controllimits, this suggests that the process…
A: A point outside the both the lower control limit ( LCL) and Upper Control Level (UCL) indicates the…
Q: Click the icon to view the table of factors for calculating three-sigma limits for the x-chart and…
A: The general formulas that can be used to solve the question are: X-bar chart: UCL= x-double bar+…
Q: the X-bar chart tells us whether there has been a change in the number of defective items in a…
A: This question is about true or false, here, X bar would be applied to the continuous data, clear…
Q: The difference between the upper specificationand the lower specification for a process is 0.6”. The…
A: USL-LSL = 0.6 Standard Deviation = 0.1
Q: A medical facility does MRI scans for sports injuries. Occasionally a test yields inconclusive…
A:
Q: 1. Calculate the loss for each unit. If required, round your answers to the nearest cent. $_______…
A: Taguchi defines the quality loss function as the damage inflicted on society by a product from the…
Q: The major use of a control charels to O measure the performance of all quality characteristics of a…
A: Control charts are the charts or the standards against which which an actual works is to measured…
Q: You want to determine the control lines for a p chart for quality control purposes. If the total…
A: Here, first I would determine the value of P¯ or the centre line, The standard deviation used in…
Q: inda Boardman, Inc., an equipment manufacturer in Boston, has submitted a sample cutoff valve to…
A: Mean (X) = 8.00 Standard Deviation () = 0.04 Lower Specification Limit (LSL) = 8 - (3 * 0.047) =…
Q: Develop X chart for the process using 35 control limits. Develop an R chart for the process using 35…
A: A control chart is a statistical tool using in decision making to identify whether a process in…
Q: An inspector counted the number of defective monthly billing statements of a telephonecompany in…
A: Since only 5 samples have been given in the question we construct an x-bar chart using the same.
Q: snip
A: so we are given the p-chart of the z table and we simply need to read the corresponding z score for…
Q: Which of the following holds the best for a point that is outside the upper control limit of a R-…
A: The correct option B. The point that lies outside of the upper control limit of an R-chart…
Q: If a point on a control chart falls outside one of the control limits, this suggests that the…
A: If an observation falls above the upper control limit or below the lower control limit, the method…
Q: Question in photos
A:
Q: The R-chart tells us whether there has been a variation in the process mean
A: R chart tells about the means and the range of a normal distribution variables in the process.
Q: DESIGNING A CONTROL CHART EXAMPLE Fujiyama Electronics, Inc. has been having difficulties with…
A: Given -
Q: A control chart for fraction nonconforming is to be established using a center line of p=0.03. What…
A:
Q: The x-bar chart tests the change in the number of defective items in a given sample- O a. FALSE Ob.…
A: Answe is option (a)
Q: Explain the purpose of the following control charts: x-bar, Range, p-chart
A: ANSWER: X BAR charts are used in order to identify if the variation are in upper or lower limits…
Q: 9 Once a sampling plan is decided between a manufacturer and its customer, then the manufacturer…
A: A quality sampling plan gives statistically valid results and great confidence in the case the…
Q: The X-bar chart reports whether if there has been a change in the number of defective items in a…
A: The answer is false.
Q: Suppose a form has 10 fields of information. If 15 forms are sampled and 21 defects are found in the…
A: DPMO - Defects per Million Opportunities - Part of the Six Sigma method is to calculate the number…
Q: Resistors for electronic circuits are manufactured on a high-speed automated machine. The machine is…
A: Sample Number Reading in Ohms 1 1016 995 991 1028 2 1024 981 991 1001 3 990 1015 1025 1012…
Q: The data processing department of the Arizona Bank has five data entry clerks. Each working day…
A: Process capability is the capacity of the process to meet the design specification for an…
Q: snip
A: Process capacity index is nothing but the statistical measure of process capacity to identify…
Q: A manufacturer of precision machine parts produces round shafts for use in the construction of drill…
A: Given Information: Average diameter (X) = 0.56 inch Average Range (R) = 0.006 inch Sample size…
Q: S6.42 Linda Boardman, Inc., an equipment manufacturer in Boston, has submitted a sample cutoff valve…
A: Mean =8 Standard deviation=0.04 Desired Performance Where standard deviation=0.045
Q: The x-bar chart tests the change in the number of defective items in a given sample Select one: O a…
A:
Q: A quality analyst wants to construct a sample mean chart for controlling a packaging process. Each…
A: The mean of all sample means is given below:
Step by step
Solved in 2 steps
- What can be said of the correlation between the brand of an automobile and its quality? a. The correlation is positive, because better brands have higher quality. b. The correlation is negative, because smaller cars tend to have higher quality and larger cars tend to have lower quality. c. If the correlation is negative, an arithmetic mistake was made; correlation must be positive. d. Correlation makes no sense here, because brand is a categorical variable.Which of the following statements regarding cost-of-quality (COQ) reporting is correct?a. Total cost of quality (COQ) consists of conformance costs plus nonconformance costs.b. Total cost of quality (COQ) consists of conformance costs plus appraisal costs.c. A typical COQ report includes out-of-pocket costs, but not opportunity costs.d. The focus of reporting is the production segment of the internal value chainPlease answer this and dont just copy paste it on google? i need some opinion here. PLEASE DONT ANSWER LIKE THIS CAUSE ITS BASICALLY FRFROM GOOOG Ans 1 Quality management” ensures superior quality products and services. Quality management is essential for client satisfaction that eventually results in client loyalty. Quality management tools facilitate an organization to style and create a product that the client truly needs and needs. Quality Management ensures magnified revenues and higher productivity for the organization. Quality management helps organizations decrease waste and inventory. Ans 2 TQM can have an important and helpful impact on worker and structure development. By having all employees focus on quality management and continuous improvement, firms will establish and uphold cultural values that make long-run success to each customer and therefore the organization itself. Core ideas for TQM areCustomer satisfaction – be client targeted.Internal customers are…
- -Answer Problem 17.5 (a, b, & c) at the end chapter 17. Show all the steps in your responses to each of the four questions. As always, clearly each response (e.g., 17.5 (a); 17.5 (b); 17.5 (c) and show all steps taken to arrive at the answers. 17.5 A manufacturer of disk drives for notebook computers wants an MTBF of at least 50,000 hours. Recent test results for 10 units were one failure at 10,000 hours, another at 25,000 hours, and two more at 45,000 hours. The remaining units were still running at 60,000 hours. Determine the following: (A)Percentage of failures (B)Number of failures per unit-hour of operating time (C)MTBF at this point in the testingThe auditor’s tests of controls revealed that required approvals of cash disbursementswere absent for a large number of sample transactions examined. Which of thefollowing is least likely to be the appropriate auditor response?(1) The auditor will communicate the deficiency to those charged with governance.(2) The auditor will increase the planned detection risk.(3) The auditor will not select more sample items to audit.(4) The auditor will perform more extensive substantive tests surrounding cash disbursements.As the acceptable level of detection risk decreases, the auditor may do one or moreof the following except change the(1) nature of audit procedures to more effective procedures.(2) timing of audit procedures, by perhaps performing them at year-end rather thanan interim date.(3) extent of audit procedures, by perhaps using larger sample sizes.(4) assurances provided by audit procedures to a lower level
- Which of the following best completes this sentence? The goal of quality control is to create defect-free products through activities such as testing. In contrast, quality assurance focuses on … a) Collecting metrics to help management monitor of the effectiveness of test and development activities. b) Selecting the development methodology and managing the development life cycle. c) The establishment and company templates, guidelines and standards. d) The software development process, not the software products being developed. e) Ensuring customer satisfaction by providing support for users and being responsive to user feedback.Experiment1: application of excel 2010 (if you have EXCEL installed on your computer) Requirement: create a pivot table and chart in excel 1. pivot table (1) basic data Please paste the table header and 1-2 rows of the data, and explain the meaning of the data. (2) pivot table Please paste the pivot table here. (3) function of this pivot table Please explain the pivot table that you have created, what is the function of the result. 2. chart (1) basic data As above (2) chart Please paste the chart here, and tell me which type of chart you have used. (3) function of this chart Please explain the chart that you have created, what is the function of the result. its management information system labAll of the following costs are likely to decrease as a result of better quality EXCEPT: Question 13Answer A. scrap costs. B. warranty and service costs. C. inspection costs. D. customer dissatisfaction costs. E. maintenance costs.
- 1. HighQualityasavalueproposition:Paras took on himself to ensure quality becomes a top differentiator and a value proposition to its customers. They started working closely with beekeepers in the Himachali region around the Himalayan foothills and in Muzaffarpur, where they encourage ethical beekeeping. Ethical beekeeping is a format where a hundred per cent of the honey is harvested at no point. Only 60% will be taken out of the hives that, or through that process, at any point, 40% will be left back for the bees.Also, through the exploration and pursuit of pure honey, Paras came across multiflora honey, which is most commonly used as a source of honey. But unfortunately, adulteration happens when a blend of multiflora honey is packaged and sold. Paras ensured that the lab tested the source from which they collected the honey to ensure the promise of purity was kept at every stage. Moreover, while sourcing the honey, the honey twig ensured that it was entirely antibiotic-free.2.…1. HighQualityasavalueproposition:Paras took on himself to ensure quality becomes a top differentiator and a value proposition to its customers. They started working closely with beekeepers in the Himachali region around the Himalayan foothills and in Muzaffarpur, where they encourage ethical beekeeping. Ethical beekeeping is a format where a hundred per cent of the honey is harvested at no point. Only 60% will be taken out of the hives that, or through that process, at any point, 40% will be left back for the bees.Also, through the exploration and pursuit of pure honey, Paras came across multiflora honey, which is most commonly used as a source of honey. But unfortunately, adulteration happens when a blend of multiflora honey is packaged and sold. Paras ensured that the lab tested the source from which they collected the honey to ensure the promise of purity was kept at every stage. Moreover, while sourcing the honey, the honey twig ensured that it was entirely antibiotic-free.2.…In this Harvard Business Review (HBR) article entitled, "How to Finance the Scale-Up of Your Company" written by Daniel Isenberg and Daniel Lawton, the authors provide practical ways to ensure your business has sources of financing, especially when scaling-up your business. https://hbr.org/2014/08/how-to-finance-the-scale-up-of-your-company INSTRUCTION: Prepare a Reaction Paper called Reading Reflection Memo (RRM). READING REACTION MEMO FOR THIS ARTICLE: The reading reaction memo after reading the article above should: (a) compare and contrast key points that strike you from the reading(s); (b) evaluate the arguments and evidence on the point(s) you cover, identifying what was insightful, mundane, unclear, incomplete, contradictory, etc.; and (c) conclude with 3-4 questions for class discussion. The reaction memo should not merely summarize the reading(s) you consider, but it should also demonstrate an active engagement with the point(s) you select to focus on, including how it (they)…