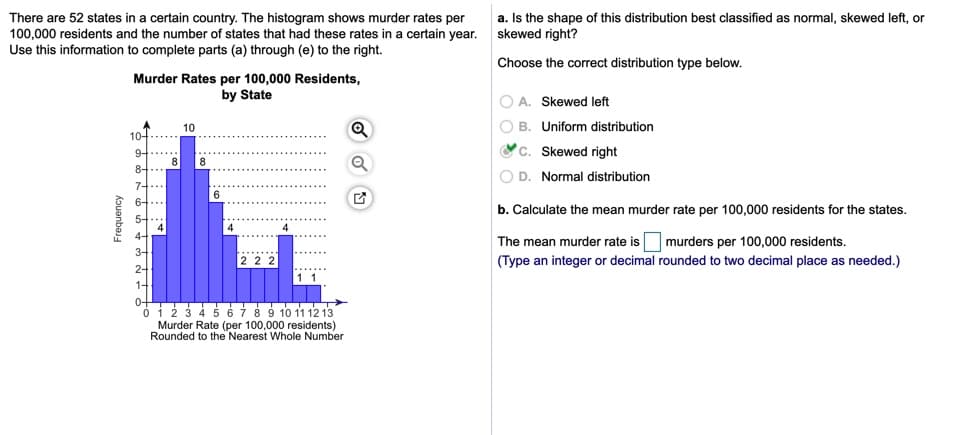
There are 52 states in a certain country. The histogram shows murder rates per 100,000 residents and the number of states that had these rates in a certain year. a. Is the shape of this distribution best classified as normal, skewed left, or skewed right? Use this information to complete parts (a) through (e) to the right. Choose the correct distribution type below. Murder Rates per 100,000 Residents, by State O A. Skewed left B. Uniform distribution 'C. Skewed right D. Normal distribution 10 10- 8. 8-.. 8. 7+... 6. 6- b. Calculate the mean murder rate per 100,000 residents for the states. The mean murder rate is murders per 100,000 residents. |(Type an integer or decimal rounded to two decimal place as needed.) 2- 1- 0+ ói 23 4 5 6789 10 1112 13 Murder Rate (per 100,000 residents) Rounded to the Nearest Whole Number Kouanbas


Inverse Normal Distribution
The method used for finding the corresponding z-critical value in a normal distribution using the known probability is said to be an inverse normal distribution. The inverse normal distribution is a continuous probability distribution with a family of two parameters.
Mean, Median, Mode
It is a descriptive summary of a data set. It can be defined by using some of the measures. The central tendencies do not provide information regarding individual data from the dataset. However, they give a summary of the data set. The central tendency or measure of central tendency is a central or typical value for a probability distribution.
Z-Scores
A z-score is a unit of measurement used in statistics to describe the position of a raw score in terms of its distance from the mean, measured with reference to standard deviation from the mean. Z-scores are useful in statistics because they allow comparison between two scores that belong to different normal distributions.


Trending now
This is a popular solution!

Step by step
Solved in 2 steps with 1 images


