There are few methods of interpolations (Newton's, Lagrange, Gregory-Newton) which able to identify or predict the daily number of cases for Covid-19. Apply at least two (2) methods to find the number of cases on 2nd March 2021 based on Figure 1.0 data.
There are few methods of interpolations (Newton's, Lagrange, Gregory-Newton) which able to identify or predict the daily number of cases for Covid-19. Apply at least two (2) methods to find the number of cases on 2nd March 2021 based on Figure 1.0 data.

MATLAB: An Introduction with Applications
6th Edition
ISBN:9781119256830
Author:Amos Gilat
Publisher:Amos Gilat
Chapter1: Starting With Matlab
Section: Chapter Questions
Problem 1P

Related questions
Question
No cursive please
Transcribed Image Text:DISTRIBUTION OF COVID-19 CASES
Source: CPRC, MOH
ACCORDING TO DATE OF CONFIRMATION
New Cases
Movement Control Order (MCO)
Conditional Movement Control Order (CMCO)
Recovery Movement Control Order (RMCO)
Discharged
3rd wave
during MCO /
CMCO / RMCO
304,822
cases
NO. OF
CASES
6000
2nd wave
during RMCO
1831 cases
5250
2340
2nd wave
4500
during CMCO
2038 cases
4055
2562
3752
3750
3320
3251
3275
2nd wave
during MCO 3rd
& 4th phase MCO
1311 cases
3085
3545
2922
1935
3000
3331
2486
2528
2548
2506
2276
2nd wave
2076
during MCO 1st &
2nd phase Mco
4314 cases
2250
2468
2364 2437
2253
2429
2063 2154
1924
1828
1745
1680
1683
1500
2nd wave
1555
1529
before MCC
651 cases
27
750
Ist wave
22 cases
DATE
24
26 27
1 2
6 7
22
23
25
28
3
4
8
Transcribed Image Text:Prediction of Covid19 daily cases using Numerical
Analysis.
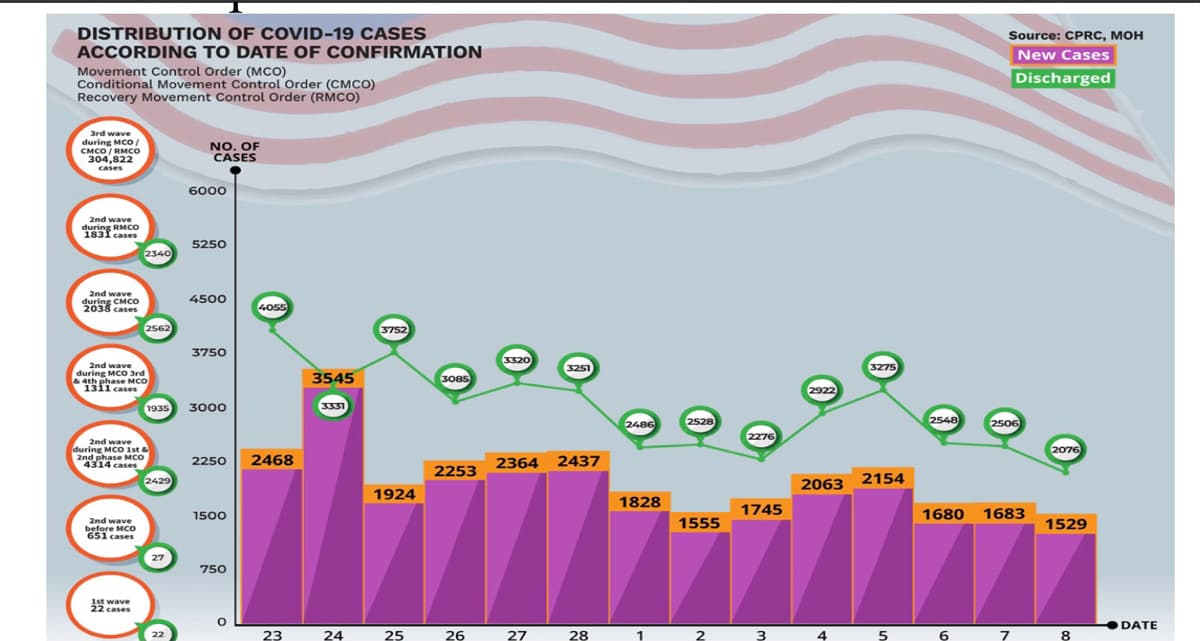
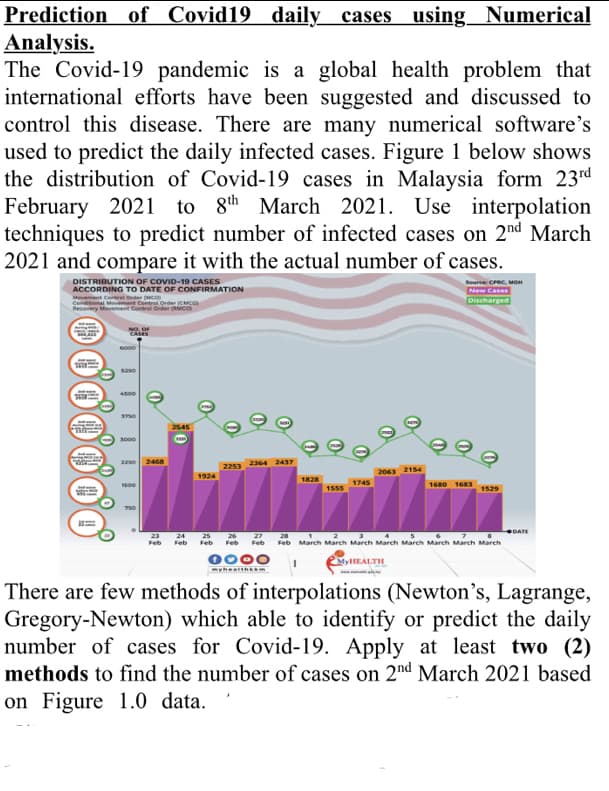
The Covid-19 pandemic is a global health problem that
international efforts have been suggested and discussed to
control this disease. There are many numerical software's
used to predict the daily infected cases. Figure 1 below shows
the distribution of Covid-19 cases in Malaysia form 23rd
February 2021 to 8th March 2021. Use interpolation
techniques to predict number of infected cases on 2nd March
2021 and compare it with the actual number of cases.
DISTRIBUTION OF COVID-19 CASES
ACCORDING TO DATE OF CONFIRMATION
Source CRC, ON
Mevemant Conrel Order Mco
Cononal Movenment Contral Order (CMCa
Recovery Movement Control Onder co
New Cases
Discharged
NO. OF
CASES
6o00
saso
400
3000
zaso
2468
2253 2364 2437
2063 2154
1924
1828
1745
1680 1683
1555
1529
750
DATE
23
24
25
27
Feb Feb Feb
Feb
Feb
Feb March March March March March March March March
0000
MYHEALTH
thealthis
There are few methods of interpolations (Newton's, Lagrange,
Gregory-Newton) which able to identify or predict the daily
number of cases for Covid-19. Apply at least two (2)
methods to find the number of cases on 2nd March 2021 based
on Figure 1.0 data.
Expert Solution
This question has been solved!
Explore an expertly crafted, step-by-step solution for a thorough understanding of key concepts.

Step by step
Solved in 6 steps

Recommended textbooks for you
MATLAB: An Introduction with Applications
Statistics
ISBN:
9781119256830
Author:
Amos Gilat
Publisher:
John Wiley & Sons Inc

Probability and Statistics for Engineering and th…
Statistics
ISBN:
9781305251809
Author:
Jay L. Devore
Publisher:
Cengage Learning

Statistics for The Behavioral Sciences (MindTap C…
Statistics
ISBN:
9781305504912
Author:
Frederick J Gravetter, Larry B. Wallnau
Publisher:
Cengage Learning
MATLAB: An Introduction with Applications
Statistics
ISBN:
9781119256830
Author:
Amos Gilat
Publisher:
John Wiley & Sons Inc
Probability and Statistics for Engineering and th…
Statistics
ISBN:
9781305251809
Author:
Jay L. Devore
Publisher:
Cengage Learning
Statistics for The Behavioral Sciences (MindTap C…
Statistics
ISBN:
9781305504912
Author:
Frederick J Gravetter, Larry B. Wallnau
Publisher:
Cengage Learning

Elementary Statistics: Picturing the World (7th E…
Statistics
ISBN:
9780134683416
Author:
Ron Larson, Betsy Farber
Publisher:
PEARSON

The Basic Practice of Statistics
Statistics
ISBN:
9781319042578
Author:
David S. Moore, William I. Notz, Michael A. Fligner
Publisher:
W. H. Freeman

Introduction to the Practice of Statistics
Statistics
ISBN:
9781319013387
Author:
David S. Moore, George P. McCabe, Bruce A. Craig
Publisher:
W. H. Freeman