These data represent the area in square miles of major islands in the Caribbean Sea and the Mediterranean Sea. Find each of these. a. Mean b. Median c. Mode
These data represent the area in square miles of major islands in the Caribbean Sea and the Mediterranean Sea. Find each of these. a. Mean b. Median c. Mode

MATLAB: An Introduction with Applications
6th Edition
ISBN:9781119256830
Author:Amos Gilat
Publisher:Amos Gilat
Chapter1: Starting With Matlab
Section: Chapter Questions
Problem 1P

Related questions
Question
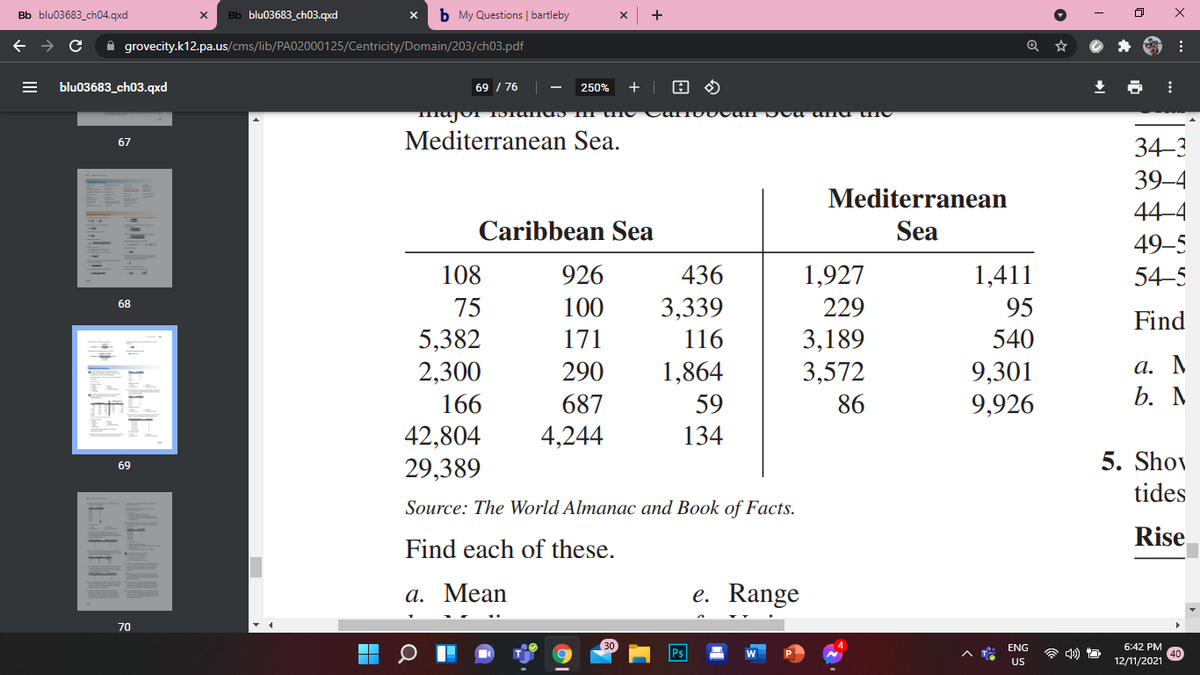
These data represent the area in square miles of
major islands in the Caribbean Sea and the
Mediterranean Sea.
Find each of these.
a. Mean
b. Median
c.
d. Midrange
e.
f. Variance
g. Standard deviation
Are the averages and variations of the areas
approximately equal?
SHOW THE COMPLETE SOLUTION
Transcribed Image Text:Bb blu03683_ch04.qxd
Bb blu03683_ch03.qxd
b My Questions | bartleby
+
A grovecity.k12.pa.us/cms/lib/PA02000125/Centricity/Domain/203/ch03.pdf
blu03683_ch03.qxd
69 / 76
250%
+
Mediterranean Sea.
34-3
67
39-4
Mediterranean
44–4
Caribbean Sea
Sea
49–5
108
926
436
1,927
1,411
54–5
3,339
116
75
100
229
95
68
Find
5,382
2,300
171
3,189
3,572
540
а. М
b. M
1,864
9,301
9,926
290
166
687
59
86
42,804
29,389
4,244
134
5. Shov
69
tides
Source: The World Almanac and Book of Facts.
Rise
Find each of these.
а. Мean
e. Range
70
ENG
6:42 PM
Ps
A T
US
12/11/2021
Expert Solution
This question has been solved!
Explore an expertly crafted, step-by-step solution for a thorough understanding of key concepts.

This is a popular solution!

Trending now
This is a popular solution!

Step by step
Solved in 3 steps

Recommended textbooks for you
MATLAB: An Introduction with Applications
Statistics
ISBN:
9781119256830
Author:
Amos Gilat
Publisher:
John Wiley & Sons Inc

Probability and Statistics for Engineering and th…
Statistics
ISBN:
9781305251809
Author:
Jay L. Devore
Publisher:
Cengage Learning

Statistics for The Behavioral Sciences (MindTap C…
Statistics
ISBN:
9781305504912
Author:
Frederick J Gravetter, Larry B. Wallnau
Publisher:
Cengage Learning
MATLAB: An Introduction with Applications
Statistics
ISBN:
9781119256830
Author:
Amos Gilat
Publisher:
John Wiley & Sons Inc
Probability and Statistics for Engineering and th…
Statistics
ISBN:
9781305251809
Author:
Jay L. Devore
Publisher:
Cengage Learning
Statistics for The Behavioral Sciences (MindTap C…
Statistics
ISBN:
9781305504912
Author:
Frederick J Gravetter, Larry B. Wallnau
Publisher:
Cengage Learning

Elementary Statistics: Picturing the World (7th E…
Statistics
ISBN:
9780134683416
Author:
Ron Larson, Betsy Farber
Publisher:
PEARSON

The Basic Practice of Statistics
Statistics
ISBN:
9781319042578
Author:
David S. Moore, William I. Notz, Michael A. Fligner
Publisher:
W. H. Freeman

Introduction to the Practice of Statistics
Statistics
ISBN:
9781319013387
Author:
David S. Moore, George P. McCabe, Bruce A. Craig
Publisher:
W. H. Freeman