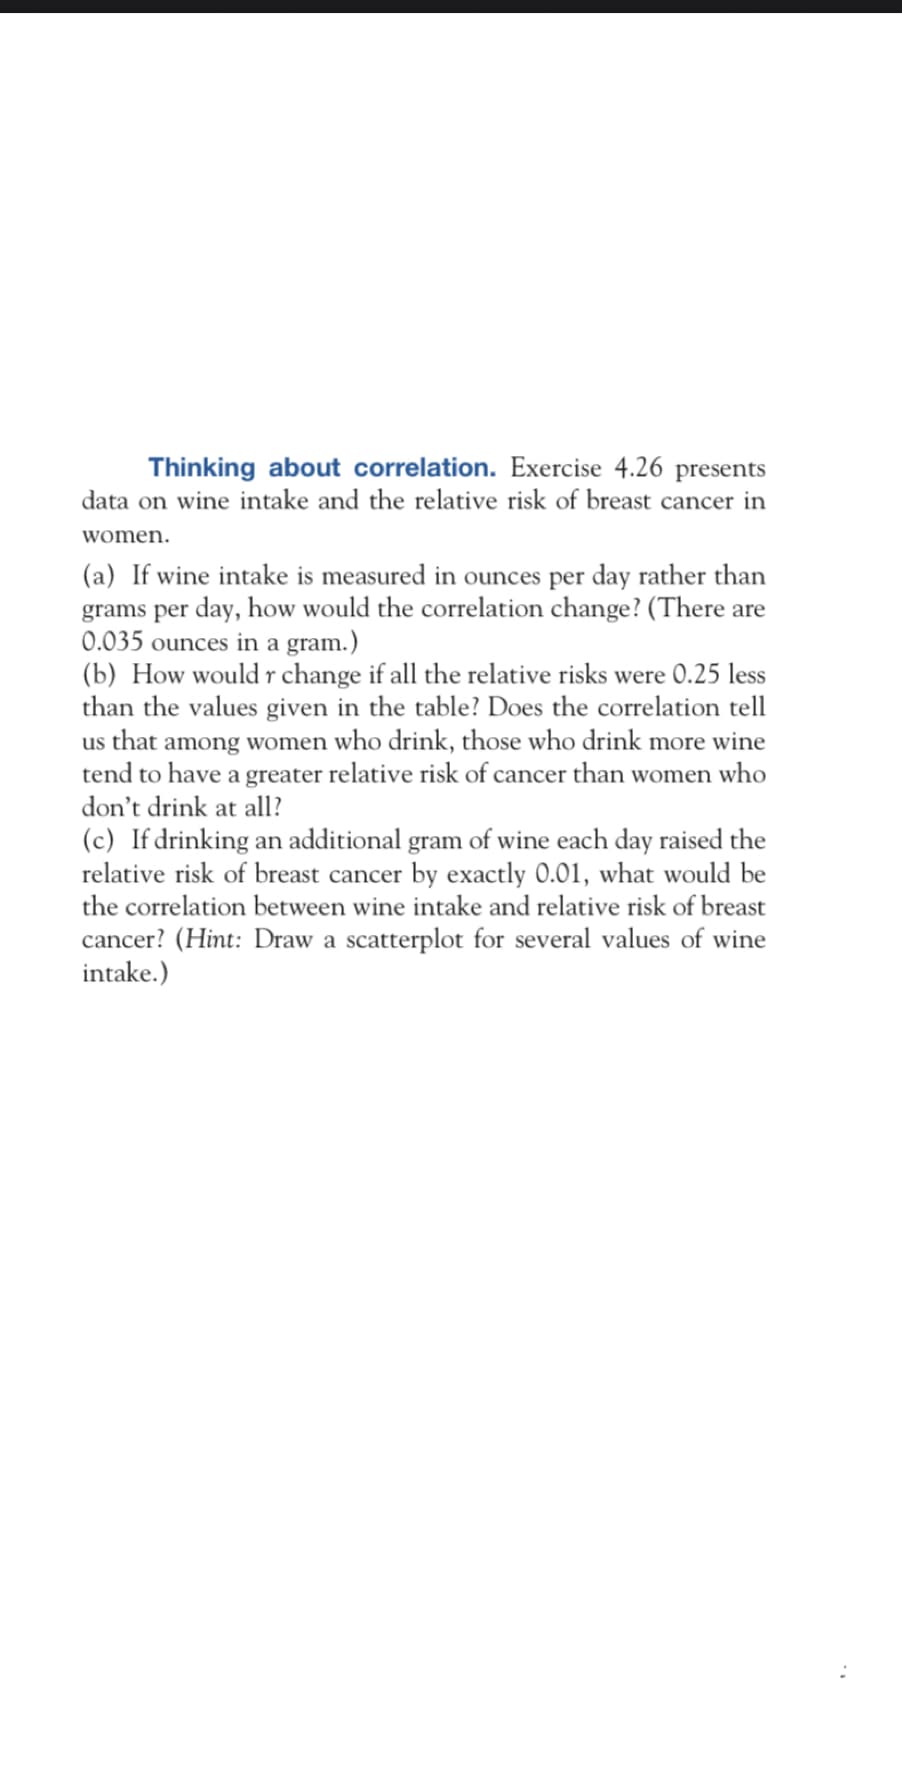
Thinking about correlation. Exercise 4.26 presents data on wine intake and the relative risk of breast cancer in women. (a) If wine intake is measured in ounces per day rather than grams per day, how would the correlation change? (There are 0.035 ounces in a gram.) (b) How would r change if all the relative risks were 0.25 less than the values given in the table? Does the correlation tell us that among women who drink, those who drink more wine tend to have a greater relative risk of cancer than women who don't drink at all? (c) If drinking an additional gram of wine each day raised the relative risk of breast cancer by exactly 0.01, what would be the correlation between wine intake and relative risk of breast cancer? (Hint: Draw a scatterplot for several values of wine intake.)

Big Ideas Math A Bridge To Success Algebra 1: Student Edition 2015
1st Edition
ISBN:9781680331141
Author:HOUGHTON MIFFLIN HARCOURT
Publisher:HOUGHTON MIFFLIN HARCOURT
Chapter4: Writing Linear Equations
Section4.5: Analyzing Lines Of Fit
Problem 27E
icon
Related questions
icon
Concept explainers
Question
Thinking about correlation. Exercise 4.26 presents
data on wine intake and the relative risk of breast cancer in
women.
(a) If wine intake is measured in ounces per day rather than
grams per day, how would the correlation change? (There are
0.035 ounces in a gram.)
(b) How would r change if all the relative risks were 0.25 less
than the values given in the table? Does the correlation tell
us that among women who drink, those who drink more wine
tend to have a greater relative risk of cancer than women who
don't drink at all?
(c) If drinking an additional gram of wine each day raised the
relative risk of breast cancer by exactly 0.01, what would be
the correlation between wine intake and relative risk of breast
cancer? (Hint: Draw a scatterplot for several values of wine
intake.)
Transcribed Image Text:Thinking about correlation. Exercise 4.26 presents data on wine intake and the relative risk of breast cancer in women. (a) If wine intake is measured in ounces per day rather than grams per day, how would the correlation change? (There are 0.035 ounces in a gram.) (b) How would r change if all the relative risks were 0.25 less than the values given in the table? Does the correlation tell us that among women who drink, those who drink more wine tend to have a greater relative risk of cancer than women who don't drink at all? (c) If drinking an additional gram of wine each day raised the relative risk of breast cancer by exactly 0.01, what would be the correlation between wine intake and relative risk of breast cancer? (Hint: Draw a scatterplot for several values of wine intake.)
Expert Solution
trending now

Trending now

This is a popular solution!

steps

Step by step

Solved in 3 steps with 5 images

Blurred answer
Knowledge Booster
Correlation, Regression, and Association
Learn more about
Need a deep-dive on the concept behind this application? Look no further. Learn more about this topic, statistics and related others by exploring similar questions and additional content below.
Recommended textbooks for you
Big Ideas Math A Bridge To Success Algebra 1: Stu…
Algebra
ISBN:
9781680331141
Author:
HOUGHTON MIFFLIN HARCOURT
Publisher:
Houghton Mifflin Harcourt
Glencoe Algebra 1, Student Edition, 9780079039897…
Algebra
ISBN:
9780079039897
Author:
Carter
Publisher:
McGraw Hill
Algebra and Trigonometry (MindTap Course List)
Algebra
ISBN:
9781305071742
Author:
James Stewart, Lothar Redlin, Saleem Watson
Publisher:
Cengage Learning
Holt Mcdougal Larson Pre-algebra: Student Edition…
Algebra
ISBN:
9780547587776
Author:
HOLT MCDOUGAL
Publisher:
HOLT MCDOUGAL
College Algebra
College Algebra
Algebra
ISBN:
9781938168383
Author:
Jay Abramson
Publisher:
OpenStax