This is a graph of the expected frequency of a deleterious allele, with a constant mutation rate, within a population at different levels of selection against it. 0.00012 0.00001 0.000008 0.000006 0.000004 0.000002 0.2 0.4 0.6 0.8 H= 10 i) What is the overall trend shown? i) What is the mutation-selection balance? ii) The formula for the equilibrium frequency of a deleterious allele within a population is p^=u/swhere u is the mutation rate and s is the selection coefficient. Using the relationships illustrated by this formula, determine the following for a population with two deleterious alleles A and B: a) If A has a high mutation rate and low selection coefficient, and B has a low mutation rate and a medium selection coefficient, which would deleterious allele would be expected to be seen in higher frequency? vd
This is a graph of the expected frequency of a deleterious allele, with a constant mutation rate, within a population at different levels of selection against it. 0.00012 0.00001 0.000008 0.000006 0.000004 0.000002 0.2 0.4 0.6 0.8 H= 10 i) What is the overall trend shown? i) What is the mutation-selection balance? ii) The formula for the equilibrium frequency of a deleterious allele within a population is p^=u/swhere u is the mutation rate and s is the selection coefficient. Using the relationships illustrated by this formula, determine the following for a population with two deleterious alleles A and B: a) If A has a high mutation rate and low selection coefficient, and B has a low mutation rate and a medium selection coefficient, which would deleterious allele would be expected to be seen in higher frequency? vd

Human Heredity: Principles and Issues (MindTap Course List)
11th Edition
ISBN:9781305251052
Author:Michael Cummings
Publisher:Michael Cummings
Chapter10: From Proteins To Phenotypes
Section: Chapter Questions
Problem 23QP

Related questions
Question
Please answer fast
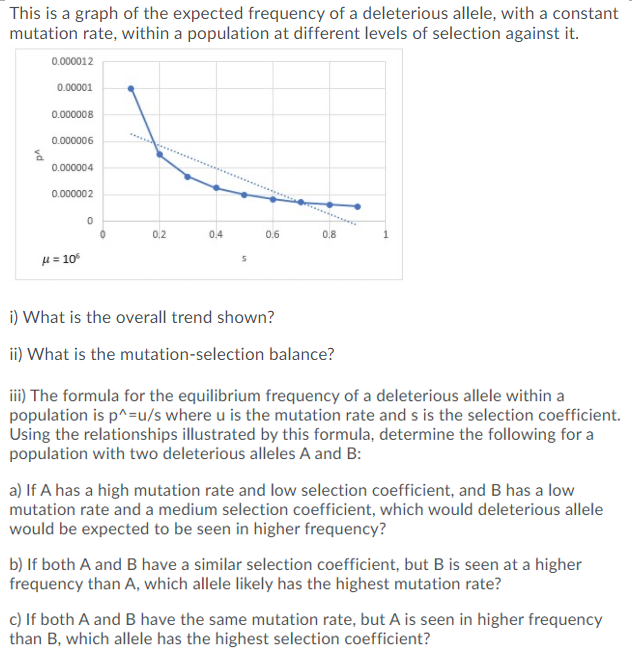
Transcribed Image Text:This is a graph of the expected frequency of a deleterious allele, with a constant
mutation rate, within a population at different levels of selection against it.
0.000012
0.00001
0.000008
0.000006
0.000004
0.000002
0.2
0.4
0.6
0.8
H = 10
i) What is the overall trend shown?
ii) What is the mutation-selection balance?
iii) The formula for the equilibrium frequency of a deleterious allele within a
population is p^=u/s where u is the mutation rate and s is the selection coefficient.
Using the relationships illustrated by this formula, determine the following for a
population with two deleterious alleles A and B:
a) If A has a high mutation rate and low selection coefficient, and B has a low
mutation rate and a medium selection coefficient, which would deleterious allele
would be expected to be seen in higher frequency?
b) If both A and B have a similar selection coefficient, but B is seen at a higher
frequency than A, which allele likely has the highest mutation rate?
c) If both A and B have the same mutation rate, but A is seen in higher frequency
than B, which allele has the highest selection coefficient?
Expert Solution
This question has been solved!
Explore an expertly crafted, step-by-step solution for a thorough understanding of key concepts.

Step by step
Solved in 2 steps with 2 images

Knowledge Booster


Learn more about
Need a deep-dive on the concept behind this application? Look no further. Learn more about this topic, biology and related others by exploring similar questions and additional content below.Recommended textbooks for you
Human Heredity: Principles and Issues (MindTap Co…
Biology
ISBN:
9781305251052
Author:
Michael Cummings
Publisher:
Cengage Learning
Human Heredity: Principles and Issues (MindTap Co…
Biology
ISBN:
9781305251052
Author:
Michael Cummings
Publisher:
Cengage Learning