
Chapter4: Utility Maximization And Choice
Section: Chapter Questions
Problem 4.2P

Related questions
Question
THIS IS NOT A GRADED ASSESSMENT, READ AGAIN THE QUESTIONS.
Please answer all questions. Thanks
Transcribed Image Text:PLEASE ANSWER ALL THE 4 QUESTIONS
For Review purposes
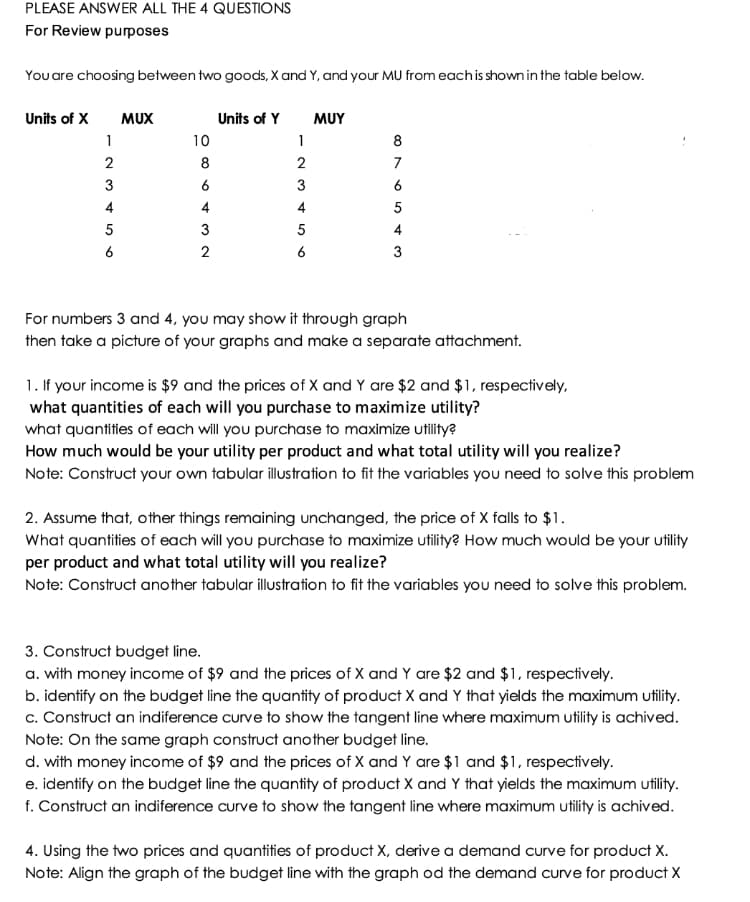
You are choosing between two goods, X and Y, and your MU from each is shown in the table below.
Units of X
MUX
Units of Y
MUY
1
10
1
8
2
2
7
6
3
6
4
4
4
5
5
3
5
4
6
2
6
3
For numbers 3 and 4, you may show it through graph
then take a picture of your graphs and make a separate attachment.
1. If your income is $9 and the prices of X and Y are $2 and $1, respectively,
what quantities of each will you purchase to maximize utility?
what quantities of each will you purchase to maximize utility?
How much would be your utility per product and what total utility will you realize?
Note: Construct your own tabular illustration to fit the variables you need to solve this problem
2. Assume that, other things remaining unchanged, the price of X falls to $1.
What quantities of each will you purchase to maximize utility? How much would be your utility
per product and what total utility will you realize?
Note: Construct another tabular illustration to fit the variables you need to solve this problem.
3. Construct budget line.
a. with money income of $9 and the prices of X and Y are $2 and $1, respectively.
b. identify on the budget line the quantity of product X and Y that yields the maximum utility.
c. Construct an indiference curve to show the tangent line where maximum utility is achived.
Note: On the same graph construct another budget line.
d. with money income of $9 and the prices of X and Y are $1 and $1, respectively.
e. identify on the budget line the quantity of product X and Y that yields the maximum utility.
f. Construct an indiference curve to show the tangent line where maximum utility is achived.
4. Using the two prices and quantities of product X, derive a demand curve for product X.
Note: Align the graph of the budget line with the graph od the demand curve for product X
Expert Solution
This question has been solved!
Explore an expertly crafted, step-by-step solution for a thorough understanding of key concepts.

Step by step
Solved in 5 steps

Knowledge Booster


Learn more about
Need a deep-dive on the concept behind this application? Look no further. Learn more about this topic, economics and related others by exploring similar questions and additional content below.Recommended textbooks for you

Principles of Economics 2e
Economics
ISBN:
9781947172364
Author:
Steven A. Greenlaw; David Shapiro
Publisher:
OpenStax

Principles of Microeconomics
Economics
ISBN:
9781305156050
Author:
N. Gregory Mankiw
Publisher:
Cengage Learning
Principles of Economics 2e
Economics
ISBN:
9781947172364
Author:
Steven A. Greenlaw; David Shapiro
Publisher:
OpenStax
Principles of Microeconomics
Economics
ISBN:
9781305156050
Author:
N. Gregory Mankiw
Publisher:
Cengage Learning


Economics (MindTap Course List)
Economics
ISBN:
9781337617383
Author:
Roger A. Arnold
Publisher:
Cengage Learning