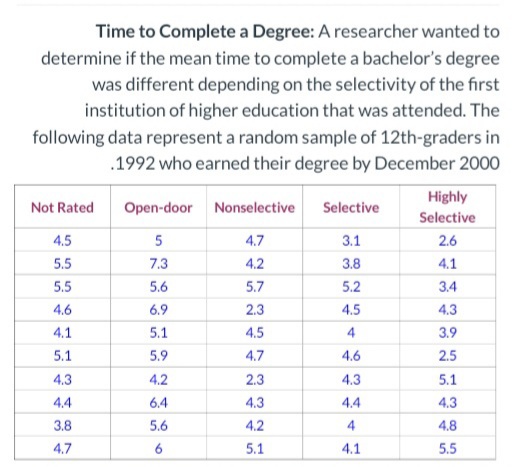
Time to Complete a Degree: A researcher wanted to determine if the mean time to complete a bachelor's degree was different depending on the selectivity of the first institution of higher education that was attended. The following data represent a random sample of 12th-graders in .1992 who earned their degree by December 2000 Highly Selective Not Rated Open-door Nonselective Selective 4.5 5 4.7 3.1 2.6 5.5 7.3 4.2 3.8 4.1 5.5 5.6 5.7 5.2 3.4 4.6 6.9 2.3 4.5 4.3 4.1 5.1 4.5 3.9 5.1 5.9 4.7 4.6 2.5 4.3 4.2 2.3 4.3 5.1 4,4 6.4 4.3 4.4 4.3 3.8 5.6 4.2 4 4.8 4.7 5.1 4.1 5.5
Time to Complete a Degree: A researcher wanted to determine if the mean time to complete a bachelor's degree was different depending on the selectivity of the first institution of higher education that was attended. The following data represent a random sample of 12th-graders in .1992 who earned their degree by December 2000 Highly Selective Not Rated Open-door Nonselective Selective 4.5 5 4.7 3.1 2.6 5.5 7.3 4.2 3.8 4.1 5.5 5.6 5.7 5.2 3.4 4.6 6.9 2.3 4.5 4.3 4.1 5.1 4.5 3.9 5.1 5.9 4.7 4.6 2.5 4.3 4.2 2.3 4.3 5.1 4,4 6.4 4.3 4.4 4.3 3.8 5.6 4.2 4 4.8 4.7 5.1 4.1 5.5

MATLAB: An Introduction with Applications
6th Edition
ISBN:9781119256830
Author:Amos Gilat
Publisher:Amos Gilat
Chapter1: Starting With Matlab
Section: Chapter Questions
Problem 1P

Related questions
Topic Video
Question
Transcribed Image Text:Time to Complete a Degree: A researcher wanted to
determine if the mean time to complete a bachelor's degree
was different depending on the selectivity of the first
institution of higher education that was attended. The
following data represent a random sample of 12th-graders in
.1992 who earned their degree by December 2000
Highly
Not Rated
Open-door Nonselective
Selective
Selective
4.5
5
4.7
3.1
2.6
5.5
7.3
4.2
3.8
4.1
5.5
5.6
5.7
5.2
3.4
4.6
6.9
2.3
4.5
4.3
4.1
5.1
4.5
4
3.9
5.1
5.9
4.7
4.6
2.5
4.3
4.2
2.3
4.3
5.1
4.4
6.4
4.3
4.4
4.3
3.8
5.6
4.2
4
4.8
4.7
5.1
4.1
5.5
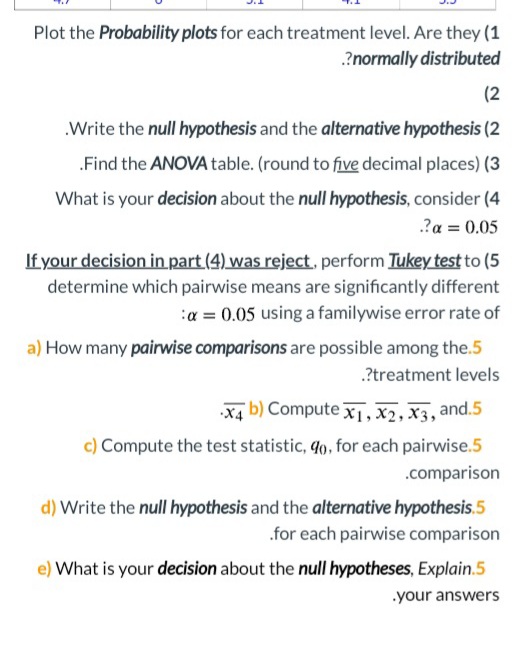
Transcribed Image Text:Plot the Probability plots for each treatment level. Are they (1
?normally distributed
(2
.Write the null hypothesis and the alternative hypothesis (2
.Find the ANOVA table. (round to five decimal places) (3
What is your decision about the null hypothesis, consider (4
3α = 0.05
If your decision in part (4) was reject, perform Tukey test to (5
determine which pairwise means are significantly different
:a = 0.05 using a familywise error rate of
a) How many pairwise comparisons are possible among the.5
.?treatment levels
X4 b) Compute x1,x2, x3, and.5
c) Compute the test statistic, 40, for each pairwise.5
.comparison
d) Write the null hypothesis and the alternative hypothesis.5
.for each pairwise comparison
) What is your decision about the null hypotheses, Explain.5
.your answers
Expert Solution
This question has been solved!
Explore an expertly crafted, step-by-step solution for a thorough understanding of key concepts.

Step by step
Solved in 3 steps with 2 images

Knowledge Booster


Learn more about
Need a deep-dive on the concept behind this application? Look no further. Learn more about this topic, statistics and related others by exploring similar questions and additional content below.Recommended textbooks for you
MATLAB: An Introduction with Applications
Statistics
ISBN:
9781119256830
Author:
Amos Gilat
Publisher:
John Wiley & Sons Inc

Probability and Statistics for Engineering and th…
Statistics
ISBN:
9781305251809
Author:
Jay L. Devore
Publisher:
Cengage Learning

Statistics for The Behavioral Sciences (MindTap C…
Statistics
ISBN:
9781305504912
Author:
Frederick J Gravetter, Larry B. Wallnau
Publisher:
Cengage Learning
MATLAB: An Introduction with Applications
Statistics
ISBN:
9781119256830
Author:
Amos Gilat
Publisher:
John Wiley & Sons Inc
Probability and Statistics for Engineering and th…
Statistics
ISBN:
9781305251809
Author:
Jay L. Devore
Publisher:
Cengage Learning
Statistics for The Behavioral Sciences (MindTap C…
Statistics
ISBN:
9781305504912
Author:
Frederick J Gravetter, Larry B. Wallnau
Publisher:
Cengage Learning

Elementary Statistics: Picturing the World (7th E…
Statistics
ISBN:
9780134683416
Author:
Ron Larson, Betsy Farber
Publisher:
PEARSON

The Basic Practice of Statistics
Statistics
ISBN:
9781319042578
Author:
David S. Moore, William I. Notz, Michael A. Fligner
Publisher:
W. H. Freeman

Introduction to the Practice of Statistics
Statistics
ISBN:
9781319013387
Author:
David S. Moore, George P. McCabe, Bruce A. Craig
Publisher:
W. H. Freeman