Sales manager of a chain restaurant wants to compare the mean daily sales of two restaurants with the same capacity located at different districts of the same city. Twelve days are selected at random and the sales data of the restaurants ('$00) are listed in the table below. Test whether the mean daily sales of these two restaurants are the same at 5% level of significance. 6. Day Restaurant 1 1 2 3 4 5 764 986 1010 1454 1910 2078 Restaurant 2 680 935 920 1304 1784 1973 Day Restaurant 1 7 9 10 11 12 698 878 1079 1343 1937 2111 Restaurant 2 641 827 1001 1283 1829 2051 Provide your numerical answer of the following questions to Moodle. a) Sample mean of differences (corrected to 2 decimal places) b) Test statistic (corrected to 4 decimal places) c) p-value (corrected to 7 decimal places)
Sales manager of a chain restaurant wants to compare the mean daily sales of two restaurants with the same capacity located at different districts of the same city. Twelve days are selected at random and the sales data of the restaurants ('$00) are listed in the table below. Test whether the mean daily sales of these two restaurants are the same at 5% level of significance. 6. Day Restaurant 1 1 2 3 4 5 764 986 1010 1454 1910 2078 Restaurant 2 680 935 920 1304 1784 1973 Day Restaurant 1 7 9 10 11 12 698 878 1079 1343 1937 2111 Restaurant 2 641 827 1001 1283 1829 2051 Provide your numerical answer of the following questions to Moodle. a) Sample mean of differences (corrected to 2 decimal places) b) Test statistic (corrected to 4 decimal places) c) p-value (corrected to 7 decimal places)

Glencoe Algebra 1, Student Edition, 9780079039897, 0079039898, 2018
18th Edition
ISBN:9780079039897
Author:Carter
Publisher:Carter
Chapter10: Statistics
Section10.5: Comparing Sets Of Data
Problem 3BGP

Related questions
Topic Video
Question
Sales manager of a chain restaurant wants to compare the
*The table is in attached*
Provide your numerical answer of the following questions to Moodle.
-
a) Sample mean of differences (corrected to 2 decimal places)
-
b) Test statistic (corrected to 4 decimal places)
-
c) p-value (corrected to 7 decimal places)
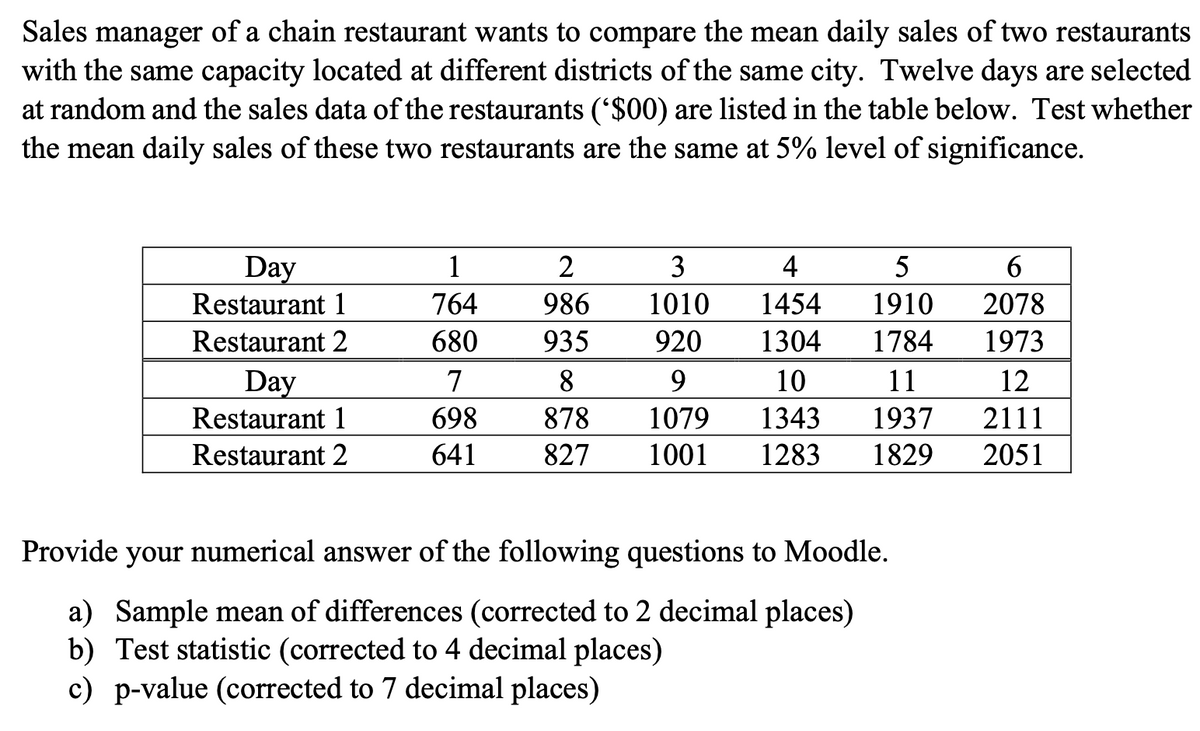
Transcribed Image Text:Sales manager of a chain restaurant wants to compare the mean daily sales of two restaurants
with the same capacity located at different districts of the same city. Twelve days are selected
at random and the sales data of the restaurants ('$00) are listed in the table below. Test whether
the mean daily sales of these two restaurants are the same at 5% level of significance.
6.
Day
Restaurant 1
1
2
3
4
5
764
986
1010
1454
1910
2078
Restaurant 2
680
935
920
1304
1784
1973
Day
Restaurant 1
7
8.
9.
10
11
12
698
878
1079
1343
1937
2111
Restaurant 2
641
827
1001
1283
1829
2051
Provide your numerical answer of the following questions to Moodle.
a) Sample mean of differences (corrected to 2 decimal places)
b) Test statistic (corrected to 4 decimal places)
c) p-value (corrected to 7 decimal places)
Expert Solution
This question has been solved!
Explore an expertly crafted, step-by-step solution for a thorough understanding of key concepts.

This is a popular solution!

Trending now
This is a popular solution!

Step by step
Solved in 2 steps with 4 images

Knowledge Booster


Learn more about
Need a deep-dive on the concept behind this application? Look no further. Learn more about this topic, statistics and related others by exploring similar questions and additional content below.Recommended textbooks for you
Glencoe Algebra 1, Student Edition, 9780079039897…
Algebra
ISBN:
9780079039897
Author:
Carter
Publisher:
McGraw Hill
Glencoe Algebra 1, Student Edition, 9780079039897…
Algebra
ISBN:
9780079039897
Author:
Carter
Publisher:
McGraw Hill