tion of a ce 101 The estimated percent dis 125 15 chart. Find the probability of each event listed in parts (a) through (d) below. (a) Randomly selecting someone who is under 5 years old The probability is%. (Round to one decimal place as needed.) (b) Randomly selecting someone who is 45 years old or over The probability is%. (Round to one decimal place as needed.) (c) Randomly selecting someone who is not 65 years old or over mpanying ple
tion of a ce 101 The estimated percent dis 125 15 chart. Find the probability of each event listed in parts (a) through (d) below. (a) Randomly selecting someone who is under 5 years old The probability is%. (Round to one decimal place as needed.) (b) Randomly selecting someone who is 45 years old or over The probability is%. (Round to one decimal place as needed.) (c) Randomly selecting someone who is not 65 years old or over mpanying ple

MATLAB: An Introduction with Applications
6th Edition
ISBN:9781119256830
Author:Amos Gilat
Publisher:Amos Gilat
Chapter1: Starting With Matlab
Section: Chapter Questions
Problem 1P

Related questions
Question
Transcribed Image Text:K
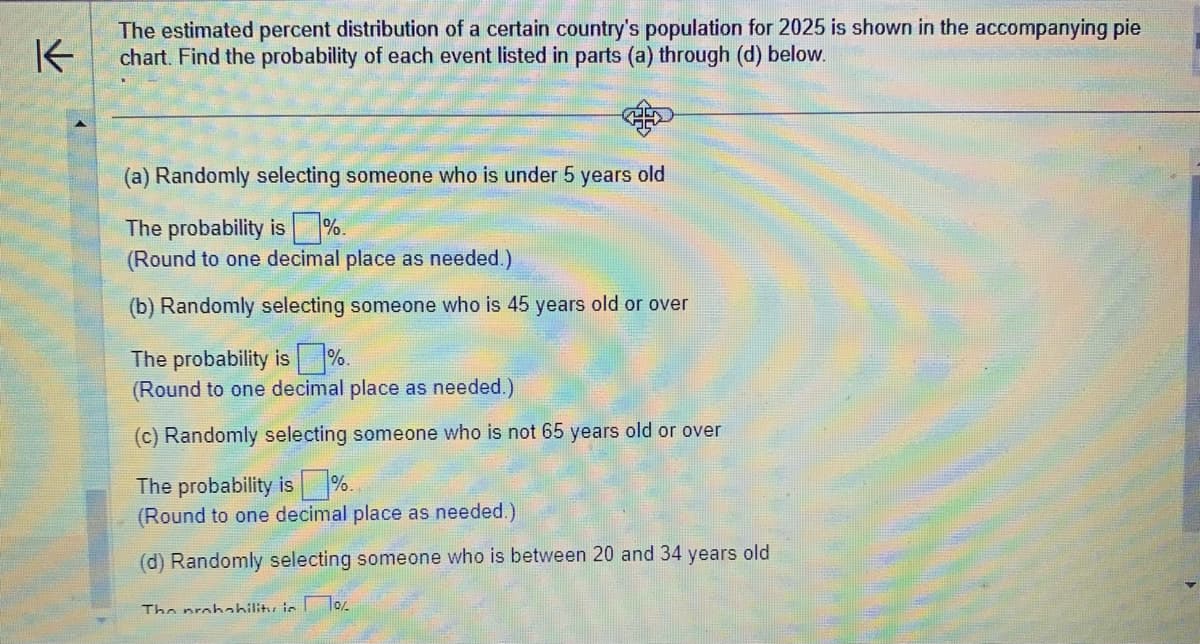
The estimated percent distribution of a certain country's population for 2025 is shown in the accompanying pie
chart. Find the probability of each event listed in parts (a) through (d) below.
(a) Randomly selecting someone who is under 5 years old
The probability is%.
(Round to one decimal place as needed.)
(b) Randomly selecting someone who is 45 years old or over
The probability is%.
(Round to one decimal place as needed.)
(c) Randomly selecting someone who is not 65 years old or over
The probability is %.
(Round to one decimal place as needed.)
(d) Randomly selecting someone who is between 20 and 34 years old
7%%
The probability is
Transcribed Image Text:K
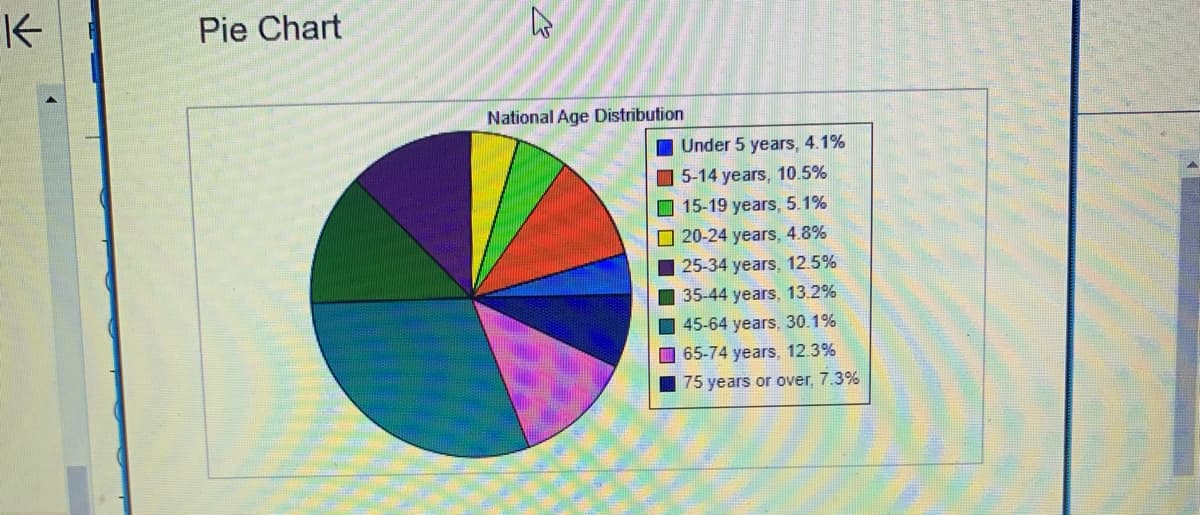
Pie Chart
National Age Distribution
Under 5 years, 4.1%
5-14 years, 10.5%
15-19 years, 5.1%
20-24 years, 4.8%
25-34 years, 12.5%
35-44 years, 13.2%
45-64 years, 30.1%
65-74 years, 12.3%
75 years or over, 7.3%
Expert Solution
This question has been solved!
Explore an expertly crafted, step-by-step solution for a thorough understanding of key concepts.

Step by step
Solved in 2 steps

Recommended textbooks for you
MATLAB: An Introduction with Applications
Statistics
ISBN:
9781119256830
Author:
Amos Gilat
Publisher:
John Wiley & Sons Inc

Probability and Statistics for Engineering and th…
Statistics
ISBN:
9781305251809
Author:
Jay L. Devore
Publisher:
Cengage Learning

Statistics for The Behavioral Sciences (MindTap C…
Statistics
ISBN:
9781305504912
Author:
Frederick J Gravetter, Larry B. Wallnau
Publisher:
Cengage Learning
MATLAB: An Introduction with Applications
Statistics
ISBN:
9781119256830
Author:
Amos Gilat
Publisher:
John Wiley & Sons Inc
Probability and Statistics for Engineering and th…
Statistics
ISBN:
9781305251809
Author:
Jay L. Devore
Publisher:
Cengage Learning
Statistics for The Behavioral Sciences (MindTap C…
Statistics
ISBN:
9781305504912
Author:
Frederick J Gravetter, Larry B. Wallnau
Publisher:
Cengage Learning

Elementary Statistics: Picturing the World (7th E…
Statistics
ISBN:
9780134683416
Author:
Ron Larson, Betsy Farber
Publisher:
PEARSON

The Basic Practice of Statistics
Statistics
ISBN:
9781319042578
Author:
David S. Moore, William I. Notz, Michael A. Fligner
Publisher:
W. H. Freeman

Introduction to the Practice of Statistics
Statistics
ISBN:
9781319013387
Author:
David S. Moore, George P. McCabe, Bruce A. Craig
Publisher:
W. H. Freeman